
Templates, printables, presets, fonts, spreadsheets, stock assets, plugins and other digital products can be created once and sold many times without shipping or inventory. Online sales keep growing, reaching 17.1% of U.S. retail sales and $340.2 billion in the second quarter of 2026, according to the Census Bureau. Low costs also mean heavy competition, so niches, quality and marketing decide success.
Businesses range from template and printable shops on marketplaces to software and plugin sellers and creators selling assets through their own sites and digital marketplaces.
The workforce
| Occupation | Jobs (2024) | Median pay (May 2024) | Projected growth, 2024 to 2034 |
|---|---|---|---|
| Graphic designers | 265,900 | $61,300 | +2% |
| Craft and fine artists | 52,000 | $56,260 | 0% |
Source: U.S. Bureau of Labor Statistics, Occupational Outlook Handbook and Occupational Employment and Wage Statistics.
Market data
| Measure | Value |
|---|---|
| U.S. retail e-commerce sales, Q2 2026 (Census) | $340.2 billion |
| E-commerce share of total retail sales, Q2 2026 | 17.1% |
Business models compared
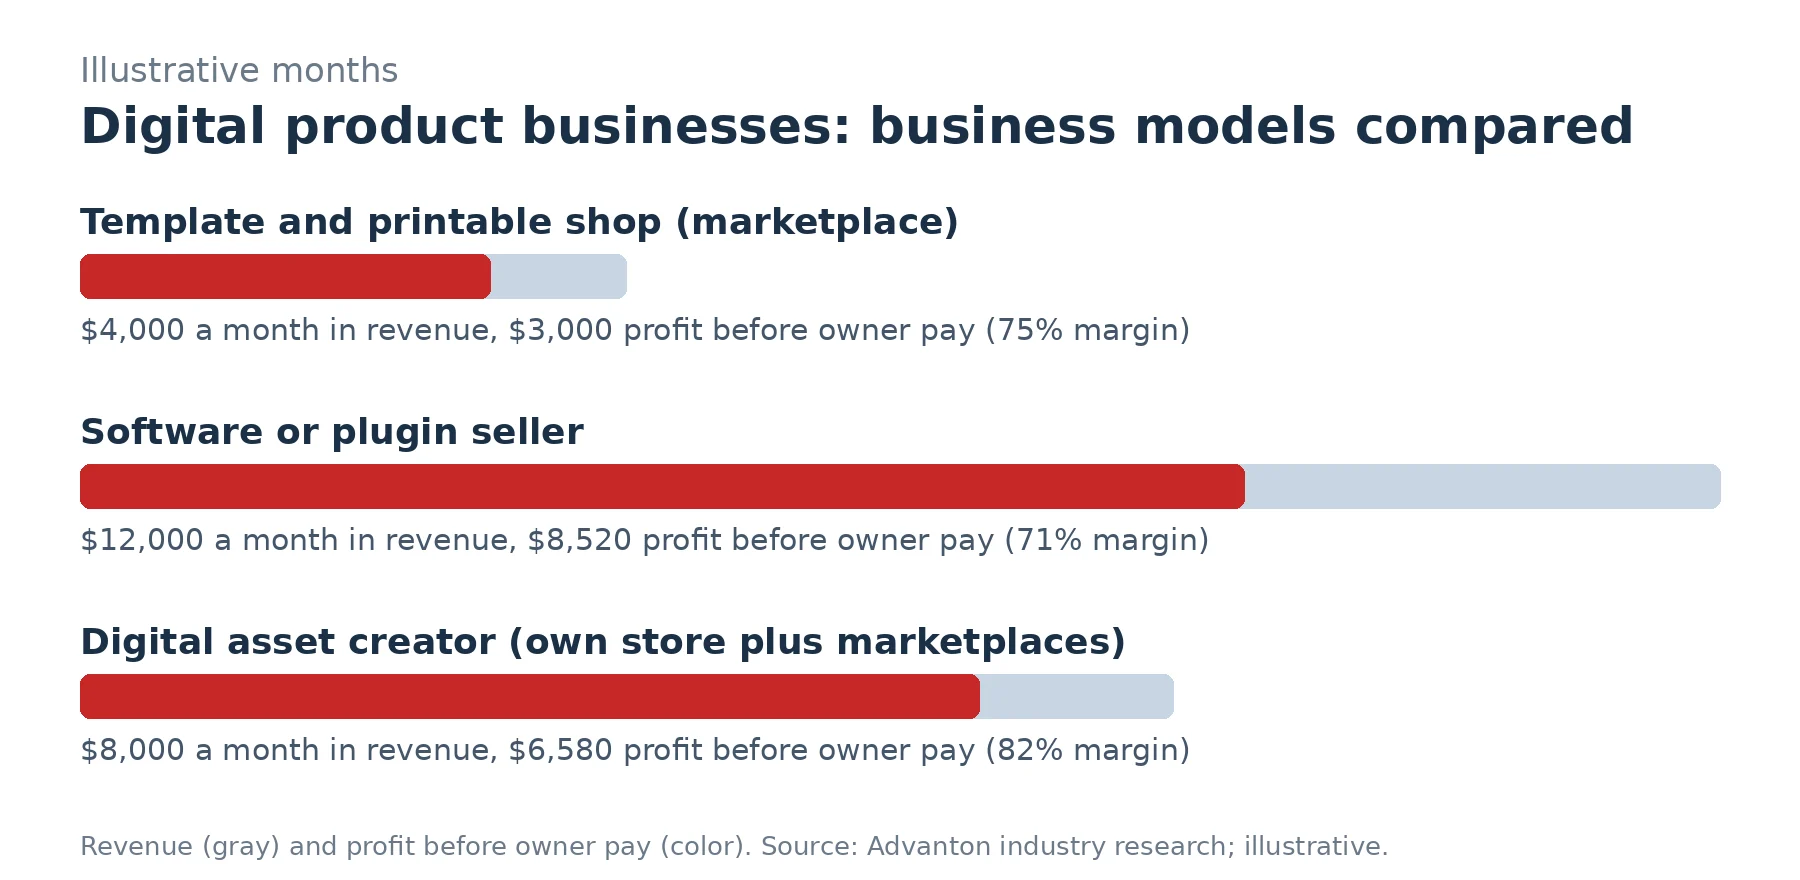
The figures below are illustrative months from our research, not industry averages. They show how revenue and costs typically fit together; your market, prices and costs will differ.
| Business model | Startup costs | Example monthly revenue | Costs | Profit before owner pay | Margin |
|---|---|---|---|---|---|
| Template and printable shop (marketplace) | Low: design software, marketplace fees, listings | $4,000 | $1,000 | $3,000 | 75% |
| Software or plugin seller | Low to moderate: development time, website, support tools | $12,000 | $3,480 | $8,520 | 71% |
| Digital asset creator (own store plus marketplaces) | Low: content creation, store platform, email list | $8,000 | $1,420 | $6,580 | 82% |
Fixed and variable costs
For projections, the most useful split is between variable costs, which rise and fall with sales (materials, supplies, hourly labor, fees), and fixed costs, which you pay every month regardless (rent, salaried staff, insurance, loan payments).
| Business model | Variable costs (% of revenue) | Fixed costs per month | What it means |
|---|---|---|---|
| Template and printable shop (marketplace) | 15.0% | $400 | Mostly fixed: needs steady volume to cover overhead |
| Software or plugin seller | 5.8% | $2,780 | Mostly fixed: needs steady volume to cover overhead |
| Digital asset creator (own store plus marketplaces) | 6.2% | $920 | Mostly fixed: needs steady volume to cover overhead |
What the numbers say
Digital products have very low variable costs, so most revenue after platform fees becomes profit.
Marketing and creation time are the real costs, especially in crowded marketplaces.
Software products earn recurring revenue but require support and updates.
The three models in brief
Template and printable shop. Planners, business templates and printables on marketplaces. See e-commerce data.
Software or plugin seller. Tools, plugins and spreadsheets with licenses and updates. See software and SaaS data.
Digital asset creator. Presets, fonts, graphics and stock assets sold through your own store and marketplaces. See graphic design data.
Cost structure: software or plugin seller
Each cost as a share of the example month’s revenue ($12,000):
| Cost | Monthly amount | Share of revenue | Type |
|---|---|---|---|
| Support contractor | $1,500 | 12.5% | Fixed |
| Ads and content | $1,000 | 8.3% | Fixed |
| Payment and licensing platform fees | $700 | 5.8% | Variable |
| Hosting and tools | $200 | 1.7% | Fixed |
| Insurance | $80 | 0.7% | Fixed |
| Profit before owner pay | $8,520 | 71% |
A first-year projection: software or plugin seller
New businesses rarely start at full speed. This projection assumes revenue ramps from 35% of the example month in month 1 to 100% by month 12, variable costs move with revenue, and fixed costs stay the same every month. It’s a planning illustration, not a forecast.
| Month | Revenue | Variable costs | Fixed costs | Profit | Cumulative |
|---|---|---|---|---|---|
| 1 | $4,200 | $244 | $2,780 | $1,176 | $1,176 |
| 2 | $5,400 | $313 | $2,780 | $2,307 | $3,483 |
| 3 | $6,600 | $383 | $2,780 | $3,437 | $6,920 |
| 4 | $7,440 | $432 | $2,780 | $4,228 | $11,148 |
| 5 | $8,400 | $487 | $2,780 | $5,133 | $16,281 |
| 6 | $9,120 | $529 | $2,780 | $5,811 | $22,092 |
| 7 | $9,840 | $571 | $2,780 | $6,489 | $28,581 |
| 8 | $10,440 | $606 | $2,780 | $7,054 | $35,635 |
| 9 | $10,920 | $633 | $2,780 | $7,507 | $43,142 |
| 10 | $11,400 | $661 | $2,780 | $7,959 | $51,101 |
| 11 | $11,760 | $682 | $2,780 | $8,298 | $59,399 |
| 12 | $12,000 | $696 | $2,780 | $8,524 | $67,923 |
Year one: revenue $107,520, profit before owner pay $67,923. The first profitable month is month 1. Cumulative results stay positive from the start, before any startup costs.
Fees move with sales and fixed costs are tiny, so this software illustration is profitable from month 1. The real investment is creation time and marketing to reach buyers.
How digital product businesses earn
- One-time product sales.
- Bundles and collections.
- Subscriptions and memberships.
- Software licenses and renewals.
- Commercial licenses at higher prices.
Licensing your products
Your license terms define how buyers can use products: personal use, commercial use, number of users or resale rights. Clear licenses prevent misuse and let you charge more for broader rights.
Rights you need
Use only fonts, images, code and templates you’re licensed to include in products for sale. Many free resources prohibit commercial resale.
A startup checklist
- Choose a niche and research demand.
- Create original products with properly licensed assets.
- Write license terms and refund policies.
- Set up your store and email list.
- Check sales tax rules for digital goods.
Sales tax on digital goods
States treat digital products differently: some tax them, some don’t, and definitions vary. Marketplaces often collect tax for you, but your own store may need to collect in certain states.
Where the opportunities are
- Business templates for specific industries.
- Spreadsheets and tools that save time.
- Educational printables.
- Design assets for creators.
- WordPress plugins and themes.
Key terms
| Term | Meaning |
|---|---|
| License | Rules for how buyers can use a digital product |
| Commercial use | Using a product to make money |
| Bundle | Multiple products sold together |
| Marketplace | Platform selling products from many creators |
Quality and support
Clear instructions, examples and responsive support reduce refunds and earn reviews that drive marketplace rankings.
Key numbers to track
Track sales, conversion rate, refund rate, revenue per product and email list growth.
Common mistakes
- Using unlicensed assets.
- No niche.
- Relying only on marketplaces.
- Unclear licenses.
- Ignoring sales tax.
Marketing digital products
SEO, Pinterest, YouTube tutorials, email lists and partnerships bring buyers. See online courses and coaching data.
Own your audience
Marketplaces control customers and can change rules or fees; an email list lets you sell new products directly and launch with built-in demand.
Software updates
Software and plugins need updates for compatibility and security; plan annual renewal fees to fund ongoing work.
Pricing
Price by value delivered, with premium tiers for commercial or extended licenses and discounts for bundles.
Piracy
Watermarks, license keys and monitoring help reduce piracy, but great service, updates and community build loyalty that pirated copies can’t match.
Refund policies
Clear refund terms shown before purchase reduce disputes; some customers will request refunds for digital goods, so decide your policy in advance.
Validating demand before creating
Before spending weeks on a product, check search demand, marketplace bestsellers and questions in communities you serve. Pre-selling or offering a simple version first shows whether people will pay, and customer feedback shapes better products.
Product listings that sell
Clear titles, preview images, explanations of what’s included, file formats, compatibility and license terms help buyers decide quickly and reduce refund requests.
Customer support at scale
FAQs, video tutorials and help articles answer common questions without one-on-one support, keeping support time low as sales grow.
Product ideas
Solve specific problems for specific audiences rather than generic products.
Test these numbers with your own plan
Open this industry in our free Business Idea Reality Check to start from any model above, change prices, costs, startup budget and your own pay, and see your break-even month, the cash you’d need, three scenarios and how new businesses in this sector survive in your state.
- Start with the closest model and its cost structure.
- Replace every price and cost with local quotes.
- Estimate your ramp: how fast customers will realistically come in year one.
- Map cash month by month with the free Cash & Payroll Planner.
- Build the full plan in the free Business Planner.
About this data
Workforce figures come from the U.S. Bureau of Labor Statistics (Occupational Outlook Handbook and Occupational Employment and Wage Statistics, May 2024 wages and the 2024 to 2034 projections, unless noted). Market figures cite their sources above. Business model figures are illustrative months built from typical prices and costs to show how revenue, fixed costs and variable costs fit together; they are not industry averages or guarantees. We review these profiles when new government data is released, at least once a year, and the same figures power the Business Idea Reality Check.
Licensing and rules
Register the business; sales tax on digital products varies widely by state, and marketplaces may collect it while your own store may need registration in some states; you need rights to everything you sell, including fonts, images and code, and your own license terms should define how buyers may use products; refund and auto-renewal policies must be clear; FTC rules apply to earnings claims, reviews and endorsements; collect customer data responsibly under privacy laws. Requirements change; confirm with your state and local agencies before you start.
Frequently asked questions
Are digital products profitable?
They can be, since there’s no inventory, but marketing and creation take time.
Do I need to collect sales tax on digital products?
It depends on state rules and where you sell.
Can I use free fonts and images in products?
Only if their licenses allow commercial resale.
What is a commercial license?
Permission for buyers to use a product to make money.
Where should I sell digital products?
Marketplaces bring traffic; your own store builds direct relationships.
How should I price digital products?
By the value delivered and the license, with bundles and premium tiers.
Do digital products need updates?
Templates and software often need updates for compatibility and customer feedback.
What do graphic designers earn?
BLS reported a median of $61,300 in May 2024.
How can I test these numbers?
Open digital product businesses in the Business Idea Reality Check and enter your own numbers.
Keep learning
Sources
- U.S. Census Bureau, Quarterly Retail E-Commerce Sales (Q2 2026)
- U.S. Bureau of Labor Statistics, Graphic designers
- U.S. Bureau of Labor Statistics, Craft and fine artists
Last reviewed November 2, 2026. Startup costs are estimates; check local prices, licensing and tax rules before you commit money.
In India
Small businesses like this in India
In MoSPI’s survey of unincorporated businesses (proprietorships, partnerships and similar firms), this falls under Information and communication (IT, software, media). In 2023-24 India had 5.5 lakh such establishments employing 8.7 lakh workers, and 83.1% were run without hired workers. Across the wider other services group, the number of establishments grew 10.29% between 2023-24 and 2025.
| Urban | Rural | All India | |
|---|---|---|---|
| Value added per business a year | ₹3,72,051 | ₹1,63,418 | ₹2,60,527 |
| Value added per worker a year | ₹1,93,520 | ₹1,27,151 | ₹1,64,695 |
| Pay per hired worker a year | ₹1,58,985 | ₹93,792 | ₹1,47,185 |
Running it alone or with staff: businesses with no hired workers added about ₹1,75,235 a year on average, while those with hired workers added about ₹6,80,974 (all India).
Where these businesses are: the states with the most small other services businesses are West Bengal (13.1%), Uttar Pradesh (11.6%), Maharashtra (8.8%), Tamil Nadu (6.2%), Gujarat (6.0%) of the national total (2023-24).
Value added is what a business produces minus what it spends on materials and other inputs, before paying its workers and owner, so it’s a rough guide to the income a typical small business generates. These figures cover the whole activity, which can be broader than this one business type. Across all small businesses, average fixed assets such as equipment, furniture and vehicles were ₹3,42,242 per establishment in 2025.
Licences and registrations to expect
- Registration under your state’s Shops and Establishments Act if you have premises or employees.
- A trade licence from your municipal corporation or council for many shop and service businesses.
- GST registration once turnover crosses ₹40 lakh for goods or ₹20 lakh for services (lower in some special category states), or earlier if you sell goods to other states or through e-commerce marketplaces.
- Professional tax registration in states that levy it.
- Free Udyam (MSME) registration, which helps with loans, government schemes and delayed-payment protection.
Rules differ by state and city. Check with your municipal corporation, state departments and a chartered accountant before you start.
Run a business like this in India? List it free in the India Business Directory, with your hours, deals and GST registration.
Free tools for India: Make a GST invoice · Compare business credit cards
Sources: MoSPI, Annual Survey of Unincorporated Sector Enterprises (ASUSE) 2023-24, full report, Appendix A Tables 4, 29, 33, 35 and 37 (survey period October 2023 to September 2024); MoSPI, Annual Survey of Unincorporated Sector Enterprises (ASUSE) 2025, factsheet (survey period January to December 2025, released 24 March 2026). Licensing summary by Advanton, checked November 2026.

