
Trucks move most of America’s freight, and the industry always needs reliable carriers. The Bureau of Labor Statistics counted about 2.2 million heavy and tractor-trailer truck drivers in 2024, with a median wage of $57,440 in May 2024, and projects about 237,600 openings a year through 2034.
Trucking businesses range from single owner-operators to small fleets and freight brokerages. Margins depend on freight rates, fuel prices, equipment costs and how well the business controls its cost per mile, all of which can swing sharply.
The workforce
| Occupation | Jobs (2024) | Median pay (May 2024) | Projected growth, 2024 to 2034 |
|---|---|---|---|
| Heavy and tractor-trailer truck drivers | about 2.2 million | $57,440 | +4% |
Source: U.S. Bureau of Labor Statistics, Occupational Outlook Handbook.
Market data
| Measure | Value |
|---|---|
| Truck driver openings per year, 2024-2034 | about 237,600 |
| Minimum public liability for interstate general freight | $750,000 |
Business models compared
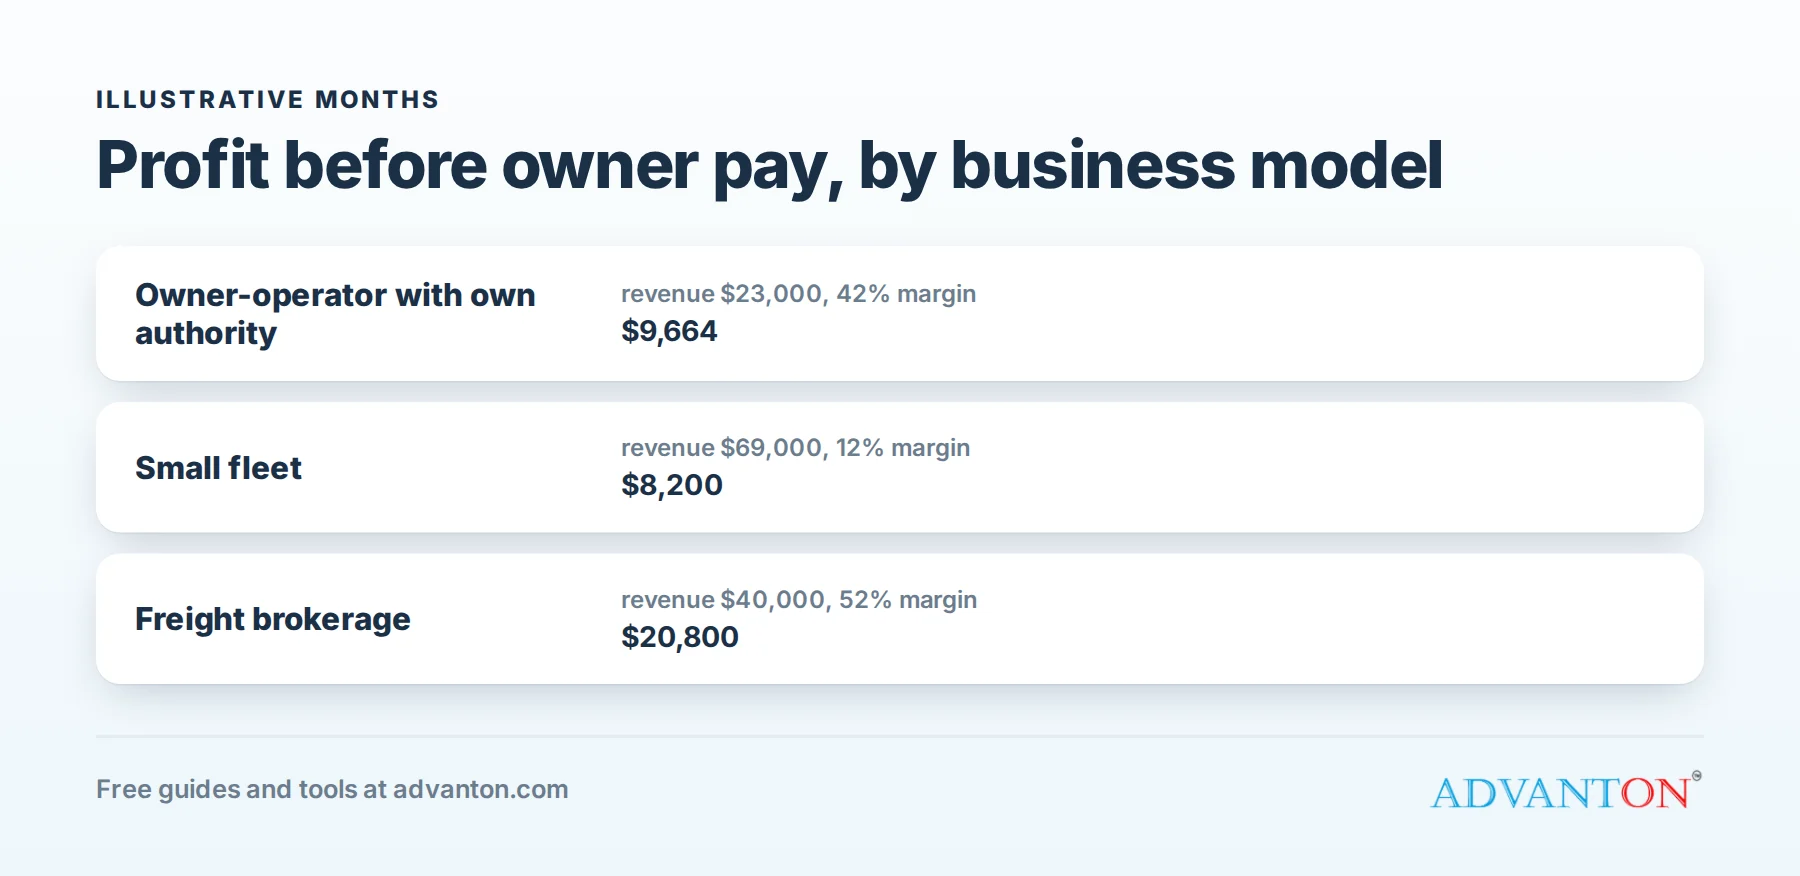
The figures below are illustrative months from our step-by-step guides, not industry averages. They show how revenue and costs typically fit together; your market, prices and costs will differ.
| Business model | Startup costs | Example monthly revenue | Costs | Profit before owner pay | Margin |
|---|---|---|---|---|---|
| Owner-operator with own authority | High: truck, insurance down payment, registrations, working capital | $23,000 | $13,336 | $9,664 | 42% |
| Small fleet (3 trucks with hired drivers) | Very high: trucks, insurance, compliance, dispatch | $69,000 | $60,800 | $8,200 | 12% |
| Freight brokerage (2 brokers; revenue = margin kept on loads) | Moderate: broker authority, bond, software, working capital | $40,000 | $19,200 | $20,800 | 52% |
Fixed and variable costs
For projections, the most useful split is between variable costs, which rise and fall with sales (materials, parts, hourly labor), and fixed costs, which you pay every month regardless (rent, salaried staff, insurance, loan payments).
| Business model | Variable costs (% of revenue) | Fixed costs per month | What it means |
|---|---|---|---|
| Owner-operator with own authority | 38.0% | $4,600 | Mostly variable: profitable early, but watch cash flow |
| Small fleet (3 trucks with hired drivers) | 63.9% | $16,700 | Mostly variable: profitable early, but watch cash flow |
| Freight brokerage (2 brokers; revenue = margin kept on loads) | 37.0% | $4,400 | Mostly variable: profitable early, but watch cash flow |
What the numbers say
Owner-operators keep a large share of revenue, but fuel, truck payments and maintenance consume most of it, and rates are volatile.
Fleets add driver pay and overhead. Margins shrink unless trucks stay loaded and maintenance is controlled.
Brokerages are asset-light. They earn a margin on each load without owning trucks, but depend on sales, carrier relationships and cash flow.
The three models in brief
Owner-operator. One truck under your own authority; see how to start a trucking company.
Small fleet. Hired drivers, dispatch and compliance management.
Freight brokerage. Matching shippers with carriers; revenue here is the margin kept on loads.
Cost structure: small fleet (3 trucks with hired drivers)
Each cost as a share of the example month’s revenue ($69,000):
| Cost | Monthly amount | Share of revenue | Type |
|---|---|---|---|
| Driver pay | $18,000 | 26.1% | Variable |
| Fuel | $17,500 | 25.4% | Variable |
| Truck payments | $8,400 | 12.2% | Fixed |
| Maintenance and tires | $5,400 | 7.8% | Variable |
| Insurance | $4,800 | 7.0% | Fixed |
| Dispatch and compliance | $3,500 | 5.1% | Fixed |
| Load boards and factoring | $2,000 | 2.9% | Variable |
| Tolls, permits and fuel taxes | $1,200 | 1.7% | Variable |
| Profit before owner pay | $8,200 | 12% |
A first-year projection: small fleet (3 trucks with hired drivers)
New businesses rarely start at full speed. This projection assumes revenue ramps from 35% of the example month in month 1 to 100% by month 12, variable costs move with revenue, and fixed costs stay the same every month. It’s a planning illustration, not a forecast.
| Month | Revenue | Variable costs | Fixed costs | Profit | Cumulative |
|---|---|---|---|---|---|
| 1 | $24,150 | $15,435 | $16,700 | -$7,985 | -$7,985 |
| 2 | $31,050 | $19,845 | $16,700 | -$5,495 | -$13,480 |
| 3 | $37,950 | $24,255 | $16,700 | -$3,005 | -$16,485 |
| 4 | $42,780 | $27,342 | $16,700 | -$1,262 | -$17,747 |
| 5 | $48,300 | $30,870 | $16,700 | $730 | -$17,017 |
| 6 | $52,440 | $33,516 | $16,700 | $2,224 | -$14,793 |
| 7 | $56,580 | $36,162 | $16,700 | $3,718 | -$11,075 |
| 8 | $60,030 | $38,367 | $16,700 | $4,963 | -$6,112 |
| 9 | $62,790 | $40,131 | $16,700 | $5,959 | -$153 |
| 10 | $65,550 | $41,895 | $16,700 | $6,955 | $6,802 |
| 11 | $67,620 | $43,218 | $16,700 | $7,702 | $14,504 |
| 12 | $69,000 | $44,100 | $16,700 | $8,200 | $22,704 |
Year one: revenue $618,240, profit before owner pay $22,704. The first profitable month is month 5. Cumulative results bottom out at -$17,747, which is the minimum cash cushion this plan would need, before any startup costs.
A fleet carries truck payments, insurance and dispatch costs from the start, so this illustration turns profitable in month 5, with a cumulative low of about $17,700. Freight rates and fuel prices can change results quickly, so plan conservatively.
How trucking businesses earn
- Per mile or per load rates from brokers and shippers.
- Fuel surcharges on some contracts.
- Accessorial charges for detention, layovers and extra stops.
- Brokerage margins between shipper rates and carrier pay.
A startup checklist
- Register: USDOT number, MC authority, BOC-3, UCR, IRP and IFTA as needed.
- Insure: at least $750,000 public liability for interstate general freight; many shippers require more.
- Set up compliance: drug and alcohol testing, ELDs, driver files and maintenance records.
- Know your cost per mile before accepting loads.
- Plan cash flow: brokers often pay in 30 days or more; consider quick-pay or factoring.
Where the opportunities are
- Dedicated lanes with direct shippers.
- Specialized freight such as refrigerated or flatbed.
- Local and regional delivery for growing businesses.
- Final-mile logistics for e-commerce.
Key terms
| Term | Meaning |
|---|---|
| Cost per mile | Total operating cost divided by miles driven |
| Deadhead | Miles driven without a load |
| Factoring | Selling invoices for faster payment, for a fee |
| MC authority | Federal operating authority for for-hire carriers |
Safety and compliance protect the business
Clean safety records keep insurance affordable and brokers willing to work with you. Maintain trucks, keep logs accurate and manage driver files carefully.
Finding freight
Load boards fill early schedules, but direct shipper relationships and dedicated lanes bring steadier rates. Track profit per load and per lane, not just revenue.
Watch the numbers weekly
Fuel, maintenance and rates change constantly. Review cost per mile, revenue per mile and deadhead every week.
How to use these numbers for your own plan
- Start with the closest model above and its cost structure.
- Replace every price and cost with local quotes: insurance, wages, vehicles, materials and your expected prices.
- Estimate your ramp: how many jobs you can realistically win each month in year one.
- Separate fixed and variable costs, then calculate your break-even point with our free break-even calculator.
- Map cash month by month with our cash flow forecast, including equipment and loan payments.
- Build the plan in our free Business Planner.
These figures will also feed a planned Advanton projection tool, so you’ll be able to start from an industry template and adjust it to your situation.
About this data
Workforce figures come from the U.S. Bureau of Labor Statistics (Occupational Outlook Handbook and Occupational Employment and Wage Statistics, May 2024 and the 2024 to 2034 projections). Market figures cite their sources in the list above. Business model figures are illustrative months built from typical prices and costs to show how revenue, fixed costs and variable costs fit together; they are not industry averages or guarantees. We review these profiles when new government data is released, at least once a year. The same figures are available in a structured format for Advanton’s upcoming business projection tool.
Licensing and rules
USDOT number; MC operating authority for for-hire interstate carriers; BOC-3; UCR; IRP and IFTA for interstate travel; CDLs; drug and alcohol testing with Clearinghouse queries; ELDs; brokers need broker authority and a surety bond. Requirements change; confirm with your state and local agencies before you start.
Frequently asked questions
What do truck drivers earn?
The BLS median was $57,440 in May 2024.
What insurance does a trucking company need?
At least $750,000 public liability for interstate general freight, plus cargo and physical damage coverage.
Is a freight brokerage cheaper to start than a carrier?
Usually, since brokers don’t own trucks, but they need broker authority, a bond and working capital.
How can I use these numbers?
Start with the closest trucking model, then replace every figure with your local prices, wages and expected volume.
Keep learning
- Owner-operator with own authority
- Local SEO for contractors
- How to get more contractor leads
- Specialty trades industry data
Sources
- U.S. Bureau of Labor Statistics, Heavy and tractor-trailer truck drivers
- Federal Motor Carrier Safety Administration
Last reviewed October 30, 2026. Startup costs are estimates; check local prices, licensing and tax rules before you commit money.

