
Key figures
- Best states to start a cleaning business: New Hampshire (71.6), New Jersey (71.5), Maryland (70.2), Connecticut (68.7), Georgia (68.6).
- Household income: highest in Massachusetts ($104,828), New Jersey ($104,294), Maryland ($102,905).
- House cleaner pay ranges from a median $25,360 a year in Mississippi to $51,600 in Hawaii; the US median is $35,510.
- Least competition: Indiana, Alabama and Georgia have the most residents per payroll house cleaner.
New Hampshire, New Jersey and Maryland are the best states to start a house cleaning business, by our measures. New Hampshire scores best on household income; the ranking weighs household income, house cleaner pay and competition, which are specific to this business, alongside growth and general business costs.
House cleaning is a service households buy when they have more income than time. Demand is strongest where incomes are high, especially among busy two-earner households.
Data: U.S. Bureau of Labor Statistics (house cleaner pay and jobs, May 2025); U.S. Census Bureau, American Community Survey 2024; Census Bureau population estimates; and Advanton’s business cost score. Scores calculated by Advanton; see How we ranked the states.
The best states to start a cleaning business
Table of Contents
The 15 best states to start a cleaning business
Advanton cleaning business score, 100 = best

Score: population growth (5%), business costs (15%), household income (40%), house cleaner pay (20%), residents per house cleaner (20%).
| Rank | State | Score | Median household income | House Cleaner median pay | Residents per house cleaner | Population growth (2025) | Business cost score |
|---|---|---|---|---|---|---|---|
| 1 | New Hampshire | 71.6 | $99,782 | $36,920 | 446 | +0.5% | 67.9 |
| 2 | New Jersey | 71.5 | $104,294 | $37,980 | 520 | +0.4% | 37.7 |
| 3 | Maryland | 70.2 | $102,905 | $35,500 | 427 | +0.3% | 48.0 |
| 4 | Connecticut | 68.7 | $96,049 | $36,170 | 552 | +0.4% | 47.1 |
| 5 | Georgia | 68.6 | $79,991 | $29,770 | 611 | +0.9% | 73.6 |
| 6 | Massachusetts | 68.0 | $104,828 | $38,950 | 480 | +0.2% | 32.9 |
| 7 | Delaware | 67.5 | $87,534 | $34,150 | 582 | +0.9% | 56.7 |
| 8 | Utah | 67.3 | $96,658 | $36,270 | 345 | +1.0% | 69.9 |
| 9 | Texas | 66.1 | $79,721 | $29,660 | 502 | +1.2% | 78.0 |
| 10 | Washington | 64.6 | $99,389 | $42,180 | 433 | +0.9% | 51.0 |
What puts these states on top
1. New Hampshire (71.6): household income $99,782 (6th highest), median house cleaner pay $36,920 (above the US median), 446 residents per house cleaner. Its strongest factors: household income and business costs.
2. New Jersey (71.5): household income $104,294 (2nd highest), median house cleaner pay $37,980 (above the US median), 520 residents per house cleaner. Its strongest factors: household income and residents per house cleaner.
3. Maryland (70.2): household income $102,905 (3rd highest), median house cleaner pay $35,500 (below the US median), 427 residents per house cleaner. Its strongest factors: household income and house cleaner pay.
4. Connecticut (68.7): household income $96,049 (10th highest), median house cleaner pay $36,170 (above the US median), 552 residents per house cleaner. Its strongest factors: residents per house cleaner and household income.
5. Georgia (68.6): household income $79,991 (23rd highest), median house cleaner pay $29,770 (below the US median), 611 residents per house cleaner. Its strongest factors: residents per house cleaner and house cleaner pay.
Household income: where demand is strongest
Where households earn the most
Median household income, 2024, dollars: the 15 highest
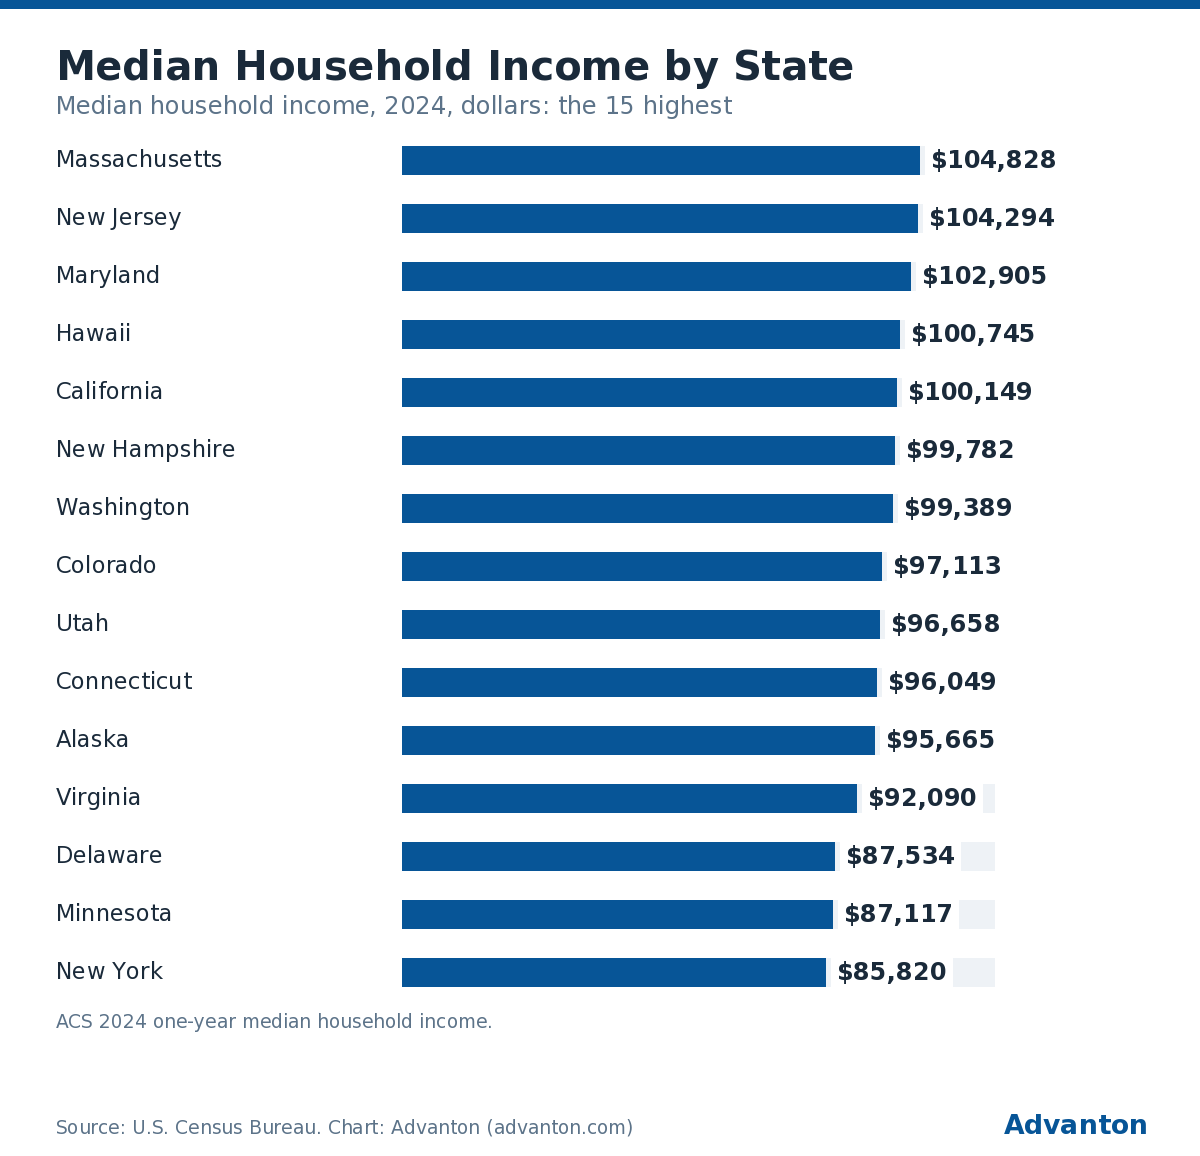
ACS 2024 one-year median household income.
Median household income, 2024: $104,828 in Massachusetts, the highest, against $59,127 in Mississippi, the lowest. Household income counts for 40% of each state’s score.
High incomes, high wages
The states where households earn the most also tend to pay cleaners the most: Hawaii, Nevada and California pay cleaners over $42,000 a year at the median, against about $25,000 in Mississippi. The best markets are those where incomes are high relative to cleaners’ pay, which our ranking rewards by scoring both.
What house cleaners earn
What house cleaners earn, by state
Median annual wage of maids and housekeeping cleaners, May 2025: the 10 highest and 10 lowest
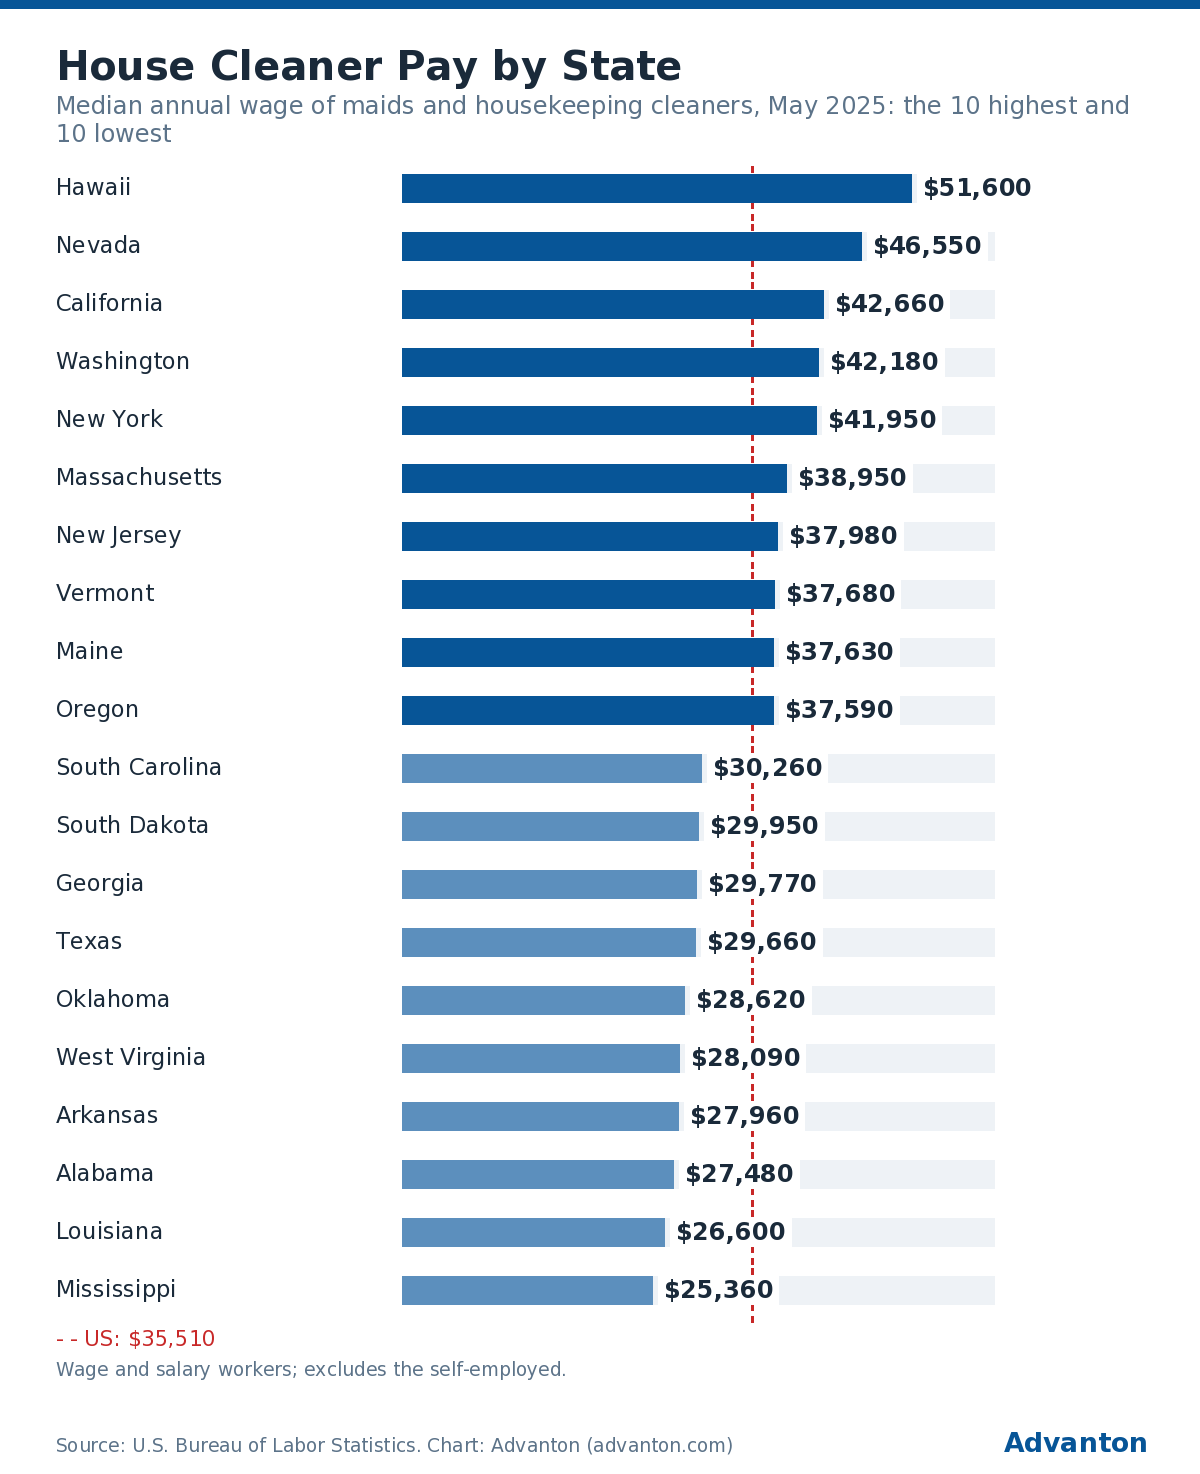
US: $35,510
Wage and salary workers; excludes the self-employed.
Pay is usually the biggest cost for a house cleaning business. The median for maids and housekeeping cleaners was $35,510 a year in May 2025, ranging from $25,360 in Mississippi to $51,600 in Hawaii. A team of four at median pay costs about $101,440 a year in Mississippi and $206,400 in Hawaii, before payroll taxes. See how much jobs pay for other occupations.
All 50 states
| Rank | State | Score | Median household income | House Cleaner median pay | House Cleaners on payroll | Residents per house cleaner | Population growth | Business cost score |
|---|---|---|---|---|---|---|---|---|
| 1 | New Hampshire | 71.6 | $99,782 | $36,920 | 3,170 | 446 | +0.5% | 67.9 |
| 2 | New Jersey | 71.5 | $104,294 | $37,980 | 18,360 | 520 | +0.4% | 37.7 |
| 3 | Maryland | 70.2 | $102,905 | $35,500 | 14,690 | 427 | +0.3% | 48.0 |
| 4 | Connecticut | 68.7 | $96,049 | $36,170 | 6,680 | 552 | +0.4% | 47.1 |
| 5 | Georgia | 68.6 | $79,991 | $29,770 | 18,510 | 611 | +0.9% | 73.6 |
| 6 | Massachusetts | 68.0 | $104,828 | $38,950 | 14,910 | 480 | +0.2% | 32.9 |
| 7 | Delaware | 67.5 | $87,534 | $34,150 | 1,820 | 582 | +0.9% | 56.7 |
| 8 | Utah | 67.3 | $96,658 | $36,270 | 10,250 | 345 | +1.0% | 69.9 |
| 9 | Texas | 66.1 | $79,721 | $29,660 | 63,110 | 502 | +1.2% | 78.0 |
| 10 | Washington | 64.6 | $99,389 | $42,180 | 18,480 | 433 | +0.9% | 51.0 |
| 11 | Virginia | 63.3 | $92,090 | $33,820 | 23,120 | 384 | +0.7% | 57.9 |
| 12 | Indiana | 62.0 | $71,959 | $31,420 | 11,050 | 631 | +0.6% | 82.8 |
| 13 | Alabama | 60.7 | $66,659 | $27,480 | 8,290 | 626 | +0.6% | 84.9 |
| 14 | Alaska | 60.1 | $95,665 | $37,370 | 2,440 | 302 | +0.1% | 64.1 |
| 15 | Colorado | 60.1 | $97,113 | $37,560 | 19,280 | 312 | +0.4% | 52.5 |
| 16 | Pennsylvania | 57.7 | $77,545 | $33,870 | 25,650 | 509 | +0.1% | 77.1 |
| 17 | Illinois | 56.6 | $83,211 | $36,380 | 26,150 | 486 | +0.1% | 60.5 |
| 18 | Idaho | 56.3 | $81,166 | $34,560 | 6,210 | 327 | +1.4% | 73.9 |
| 19 | Minnesota | 55.9 | $87,117 | $37,470 | 14,890 | 392 | +0.6% | 56.6 |
| 20 | Kansas | 55.2 | $75,514 | $31,100 | 7,540 | 395 | +0.4% | 81.2 |
| 21 | Iowa | 55.0 | $75,501 | $32,620 | 8,160 | 397 | +0.2% | 87.8 |
| 22 | South Carolina | 55.0 | $72,350 | $30,260 | 14,500 | 384 | +1.5% | 78.0 |
| 23 | South Dakota | 54.7 | $76,881 | $29,950 | 3,540 | 264 | +0.9% | 87.5 |
| 24 | Arizona | 53.5 | $81,486 | $35,640 | 21,180 | 360 | +0.9% | 63.9 |
| 25 | California | 53.5 | $100,149 | $42,660 | 103,430 | 381 | -0.0% | 18.3 |
| 26 | North Carolina | 53.4 | $73,958 | $31,310 | 33,080 | 339 | +1.3% | 77.8 |
| 27 | Michigan | 53.0 | $72,389 | $34,650 | 18,690 | 542 | +0.3% | 70.2 |
| 28 | Rhode Island | 52.5 | $83,504 | $37,540 | 2,710 | 411 | +0.4% | 54.5 |
| 29 | Tennessee | 52.3 | $71,997 | $30,850 | 20,500 | 357 | +0.9% | 81.9 |
| 30 | Wisconsin | 52.3 | $77,488 | $35,530 | 14,520 | 411 | +0.3% | 73.7 |
| 31 | Ohio | 52.0 | $72,212 | $32,170 | 28,930 | 411 | +0.3% | 81.3 |
| 32 | North Dakota | 51.0 | $77,871 | $35,050 | 2,880 | 278 | +0.8% | 83.4 |
| 33 | Nebraska | 50.3 | $76,376 | $34,170 | 6,250 | 323 | +0.6% | 76.0 |
| 34 | New York | 50.3 | $85,820 | $41,950 | 41,740 | 479 | +0.0% | 42.0 |
| 35 | Arkansas | 49.8 | $62,106 | $27,960 | 6,930 | 449 | +0.6% | 87.2 |
| 36 | Missouri | 49.4 | $71,589 | $33,670 | 15,360 | 408 | +0.4% | 75.9 |
| 37 | Oregon | 49.1 | $85,220 | $37,590 | 12,920 | 331 | +0.2% | 49.0 |
| 38 | Oklahoma | 49.0 | $66,148 | $28,620 | 11,810 | 349 | +0.6% | 87.4 |
| 39 | Vermont | 48.7 | $82,730 | $37,680 | 1,830 | 352 | -0.3% | 60.6 |
| 40 | Wyoming | 48.6 | $75,532 | $31,870 | 2,800 | 210 | +0.3% | 88.7 |
| 41 | Florida | 48.3 | $77,735 | $33,860 | 79,550 | 295 | +0.8% | 61.0 |
| 42 | Kentucky | 47.1 | $64,526 | $30,880 | 12,040 | 383 | +0.5% | 89.0 |
| 43 | Louisiana | 45.6 | $60,986 | $26,600 | 12,440 | 371 | +0.1% | 89.1 |
| 44 | Mississippi | 45.2 | $59,127 | $25,360 | 8,320 | 355 | +0.1% | 92.8 |
| 45 | New Mexico | 45.0 | $67,816 | $30,480 | 6,180 | 344 | -0.1% | 78.2 |
| 46 | Maine | 43.5 | $76,442 | $37,630 | 4,960 | 285 | +0.5% | 64.9 |
| 47 | Montana | 43.4 | $75,340 | $35,740 | 5,380 | 213 | +0.6% | 73.7 |
| 48 | Hawaii | 41.3 | $100,745 | $51,600 | 11,120 | 129 | -0.1% | 40.6 |
| 49 | West Virginia | 40.4 | $60,798 | $28,090 | 6,110 | 289 | -0.1% | 87.8 |
| 50 | Nevada | 36.6 | $81,134 | $46,550 | 24,380 | 135 | +0.9% | 67.7 |
House Cleaners on payroll: wage and salary jobs for maids and housekeeping cleaners in May 2025 (BLS); the self-employed aren’t counted, so residents per house cleaner is a rough guide to competition. The US average is about 396 residents per payroll house cleaner.
How we ranked the states
| Factor | Weight | Measure | Source |
|---|---|---|---|
| Household income | 40% | Median household income, 2024 | U.S. Census Bureau, American Community Survey 2024 (Household Income in States and Metropolitan Areas: 2024) |
| House Cleaner pay | 20% | Median annual wage of maids and housekeeping cleaners, May 2025 (lower is better for an employer) | U.S. Bureau of Labor Statistics |
| Competition | 20% | Residents per house cleaner on payroll (more is better) | BLS and Census Bureau |
| Population growth | 5% | Change in population, July 2024 to July 2025 | U.S. Census Bureau |
| General business costs | 15% | Advanton’s business cost score: pay, rents, taxes, minimum wage, prices and LLC fees | BLS, BEA, Tax Foundation, Advanton |
We rank the 50 states; the District of Columbia isn’t ranked because it’s a single city. Factors specific to cleaning make up 80% of the score; shared factors (population growth and business costs) make up 20%. For each factor, the best state scores 100 and the worst 0, with the rest in proportion.
Before you start a house cleaning business
- Check licensing. Most states don’t license residential cleaners, but you’ll need a business license from your city or county, and some states require registration to sell services.
- Get insured. General liability insurance and a janitorial or fidelity bond reassure clients whose homes you enter, and workers’ compensation is required in most states once you hire.
- Form your business where you work. See LLC filing fees by state and the state guides linked in the tables.
- Plan your numbers. Test your plan with the Business Idea Reality Check.
Related rankings
- Best states to start a landscaping business
- Best states to start a home care business
- Best states to start a painting business
- All rankings: cheapest states to start a business
Frequently asked questions
What is the best state to start a cleaning business?
New Hampshire, by our ranking, followed by New Jersey and Maryland.
Where do households spend most on cleaning services?
Where incomes are highest: Massachusetts, New Jersey and Maryland have the highest median household incomes, according to the Census Bureau.
How much do house cleaners make?
The median for maids and housekeeping cleaners was $35,510 a year in May 2025, from $25,360 in Mississippi to $51,600 in Hawaii.
Which states have the most house cleaners?
California (103,430), Florida (79,550), Texas (63,110) have the most on payroll.
About the data
- House Cleaner pay and jobs: U.S. Bureau of Labor Statistics, Occupational Employment and Wage Statistics, May 2025, state estimates for maids and housekeeping cleaners (SOC 37-2012). The state jobs add up to the national total.
- Household income: U.S. Census Bureau, American Community Survey 2024 (Household Income in States and Metropolitan Areas: 2024). ACS 2024 one-year median household income.
- Next update: when BLS publishes May 2026 wages for maids and housekeeping cleaners (spring 2027).
Use this chart
Cite, embed or download the charts free with the buttons above them. Please keep the credit link.
Sources
- U.S. Bureau of Labor Statistics, Occupational Employment and Wage Statistics, May 2025, maids and housekeeping cleaners (37-2012), state estimates
- U.S. Census Bureau, American Community Survey 2024 (Household Income in States and Metropolitan Areas: 2024)
- U.S. Census Bureau, state population estimates, Vintage 2025
- Advanton, cheapest states to start a business (business cost score)
Last reviewed November 19, 2026. Startup costs are estimates; check local prices, licensing and tax rules before you commit money.
Advanton presents official data as easy-to-read charts and figures. The figures on this page come from the sources named with each statistic and chart, and those sources may revise them. This page is general information, not financial or investment advice. See our disclaimer.