
Solar photovoltaic installers are the second-fastest-growing occupation in the BLS 2024 to 2034 projections, with employment expected to grow 42% from about 28,600 jobs in 2024. Median pay was $51,860 in May 2024, and about 4,100 openings are projected each year.
Solar businesses range from full-service residential installers that sell, design and install systems, to subcontract crews that install for others, to maintenance and repair specialists serving the growing number of existing systems. Margins depend heavily on equipment costs, sales efficiency and the incentive rules in each state.
The workforce
| Occupation | Jobs (2024) | Median pay (May 2024) | Projected growth, 2024 to 2034 |
|---|---|---|---|
| Solar photovoltaic installers | about 28,600 | $51,860 | +42% |
Source: U.S. Bureau of Labor Statistics, Occupational Outlook Handbook.
Market data
| Measure | Value |
|---|---|
| Rank among fastest-growing occupations, 2024-2034 | 2nd |
| New solar installer jobs projected, 2024-2034 | 12,000 |
| Openings per year, 2024-2034 | about 4,100 |
Business models compared
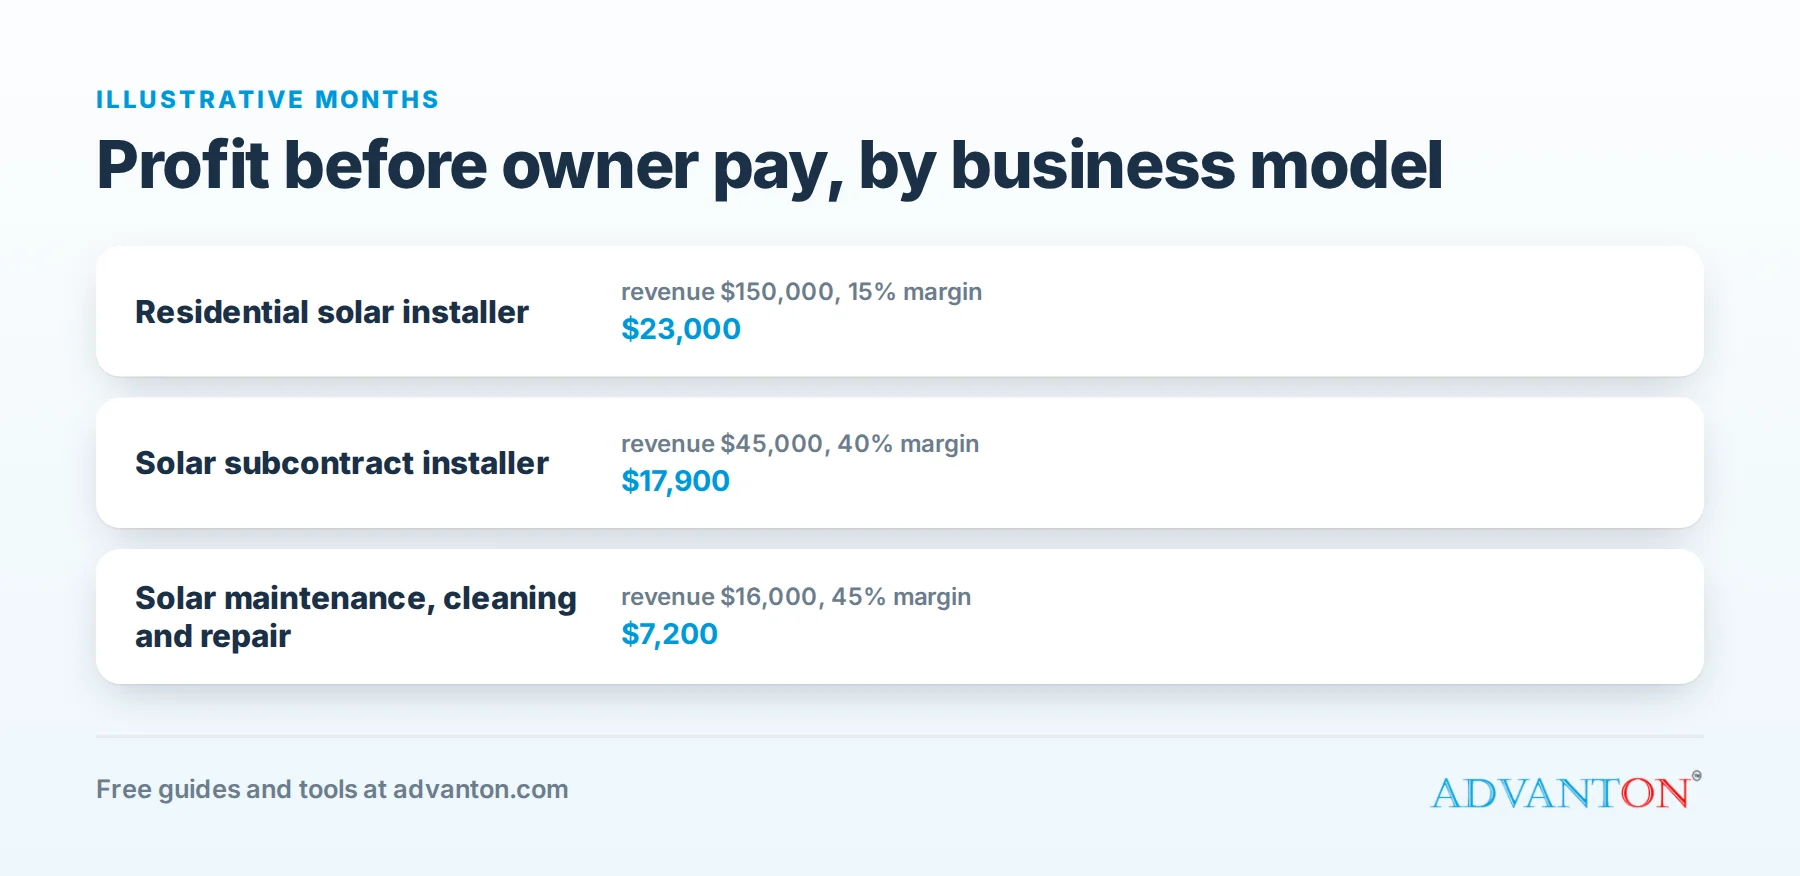
The figures below are illustrative months from our step-by-step guides, not industry averages. They show how revenue and costs typically fit together; your market, prices and costs will differ.
| Business model | Startup costs | Example monthly revenue | Costs | Profit before owner pay | Margin |
|---|---|---|---|---|---|
| Residential solar installer (2 crews) | High: licensing, crews, trucks, working capital for equipment | $150,000 | $127,000 | $23,000 | 15% |
| Solar subcontract installer | Moderate: tools, truck, safety gear, licensing | $45,000 | $27,100 | $17,900 | 40% |
| Solar maintenance, cleaning and repair | Low to moderate: tools, monitoring software, truck | $16,000 | $8,800 | $7,200 | 45% |
Fixed and variable costs
For projections, the most useful split is between variable costs, which rise and fall with sales (materials, parts, hourly labor), and fixed costs, which you pay every month regardless (rent, salaried staff, insurance, loan payments).
| Business model | Variable costs (% of revenue) | Fixed costs per month | What it means |
|---|---|---|---|
| Residential solar installer (2 crews) | 70.0% | $22,000 | Mostly variable: profitable early, but watch cash flow |
| Solar subcontract installer | 51.6% | $3,900 | Mostly variable: profitable early, but watch cash flow |
| Solar maintenance, cleaning and repair | 15.0% | $6,400 | Mostly fixed: slow start-up months are expensive |
What the numbers say
Equipment dominates costs. Panels, inverters and racking take a large share of every residential job, so purchasing and design efficiency decide margins.
Sales costs are significant. Commissions and marketing for residential solar are high; referrals and partnerships lower them.
Service is a growing niche. Millions of existing systems need monitoring, cleaning, repairs and inverter replacements.
The three models in brief
Residential installer. Sells, designs, permits and installs complete systems; the highest revenue and the most complexity. See electrical leads for related marketing.
Subcontract installer. Installs for other companies; steady volume without sales costs, but lower prices per job.
Maintenance and repair. Serves existing system owners, often with recurring monitoring plans.
Cost structure: residential solar installer (2 crews)
Each cost as a share of the example month’s revenue ($150,000):
| Cost | Monthly amount | Share of revenue | Type |
|---|---|---|---|
| Panels, inverters and racking | $66,000 | 44.0% | Variable |
| Installation crews | $24,000 | 16.0% | Variable |
| Sales commissions | $12,000 | 8.0% | Variable |
| Office and design staff | $9,000 | 6.0% | Fixed |
| Marketing | $6,000 | 4.0% | Fixed |
| Permits and interconnection | $3,000 | 2.0% | Variable |
| Insurance | $3,000 | 2.0% | Fixed |
| Vehicles | $3,000 | 2.0% | Fixed |
| Software | $1,000 | 0.7% | Fixed |
| Profit before owner pay | $23,000 | 15% |
A first-year projection: residential solar installer (2 crews)
New businesses rarely start at full speed. This projection assumes revenue ramps from 35% of the example month in month 1 to 100% by month 12, variable costs move with revenue, and fixed costs stay the same every month. It’s a planning illustration, not a forecast.
| Month | Revenue | Variable costs | Fixed costs | Profit | Cumulative |
|---|---|---|---|---|---|
| 1 | $52,500 | $36,750 | $22,000 | -$6,250 | -$6,250 |
| 2 | $67,500 | $47,250 | $22,000 | -$1,750 | -$8,000 |
| 3 | $82,500 | $57,750 | $22,000 | $2,750 | -$5,250 |
| 4 | $93,000 | $65,100 | $22,000 | $5,900 | $650 |
| 5 | $105,000 | $73,500 | $22,000 | $9,500 | $10,150 |
| 6 | $114,000 | $79,800 | $22,000 | $12,200 | $22,350 |
| 7 | $123,000 | $86,100 | $22,000 | $14,900 | $37,250 |
| 8 | $130,500 | $91,350 | $22,000 | $17,150 | $54,400 |
| 9 | $136,500 | $95,550 | $22,000 | $18,950 | $73,350 |
| 10 | $142,500 | $99,750 | $22,000 | $20,750 | $94,100 |
| 11 | $147,000 | $102,900 | $22,000 | $22,100 | $116,200 |
| 12 | $150,000 | $105,000 | $22,000 | $23,000 | $139,200 |
Year one: revenue $1,344,000, profit before owner pay $139,200. The first profitable month is month 3. Cumulative results bottom out at -$8,000, which is the minimum cash cushion this plan would need, before any startup costs.
Office staff, design and marketing costs arrive before installation volume, so this illustration turns profitable in month 3. Equipment is often paid before customers or financing companies pay, so working capital matters.
How solar companies price
- Residential systems priced per watt installed, with options for batteries and upgrades.
- Subcontract installs per watt or per job.
- Maintenance by visit or annual plan.
Incentives, net metering and utility rules change; check current rules before quoting.
A startup checklist
- Get the right license: electrical or specialty solar, depending on your state.
- Learn local permitting and each utility’s interconnection process.
- Train crews for fall protection and electrical safety.
- Set up supplier accounts and financing partners.
- Build your local presence: see local SEO for contractors.
Where the opportunities are
- Battery storage added to existing systems.
- Service and repair for aging systems.
- Commercial rooftops for small businesses.
- Partnerships with roofers and electricians.
Key terms
| Term | Meaning |
|---|---|
| Per-watt pricing | System price divided by its capacity in watts |
| Interconnection | Utility approval to connect a system to the grid |
| Net metering | Credit for power sent back to the grid, where offered |
| Inverter | Converts solar DC power to household AC power |
Honest selling builds the business
Solar sales have drawn consumer complaints about pressure tactics and unrealistic savings promises. Clear, conservative savings estimates, plain explanations of financing and incentives, and no pressure win referrals and protect your license.
Marketing a solar company
Referrals from satisfied customers, partnerships with roofers and electricians, and helpful content about real costs and savings bring better leads than aggressive door-to-door campaigns. Track cost per signed contract by channel.
Watch the policy landscape
Incentives, tax credits and net metering rules change. Build your business so it still works if incentives shrink: efficient installs, service revenue and honest customer relationships.
How to use these numbers for your own plan
- Start with the closest model above and its cost structure.
- Replace every price and cost with local quotes: insurance, wages, vehicles, materials and your expected prices.
- Estimate your ramp: how many jobs you can realistically win each month in year one.
- Separate fixed and variable costs, then calculate your break-even point with our free break-even calculator.
- Map cash month by month with our cash flow forecast, including equipment and loan payments.
- Build the plan in our free Business Planner.
These figures will also feed a planned Advanton projection tool, so you’ll be able to start from an industry template and adjust it to your situation.
About this data
Workforce figures come from the U.S. Bureau of Labor Statistics (Occupational Outlook Handbook and Occupational Employment and Wage Statistics, May 2024 and the 2024 to 2034 projections). Market figures cite their sources in the list above. Business model figures are illustrative months built from typical prices and costs to show how revenue, fixed costs and variable costs fit together; they are not industry averages or guarantees. We review these profiles when new government data is released, at least once a year. The same figures are available in a structured format for Advanton’s upcoming business projection tool.
Licensing and rules
Solar installation typically requires an electrical or specialty solar contractor license, depending on the state; permits, inspections and utility interconnection approval for each system; OSHA fall protection and electrical safety rules; incentive and net-metering rules vary by state and change over time. Requirements change; confirm with your state and local agencies before you start.
Frequently asked questions
Is solar installation a growing career?
Yes. BLS projects 42% growth from 2024 to 2034, second-fastest of all occupations.
What do solar installers earn?
The BLS median was $51,860 in May 2024.
Do solar installers need a license?
Usually an electrical or specialty solar contractor license, depending on the state.
How can I use these numbers?
Start with the closest solar model, then replace every figure with your own local prices, wages and expected job volume.
Keep learning
- Residential solar installer
- Local SEO for contractors
- How to get more contractor leads
- Specialty trades industry data
Sources
- U.S. Bureau of Labor Statistics, Fastest growing occupations 2024-34
- NewsNation summary of BLS fastest-growing occupations
- TradeColleges.org summary of BLS Employment Projections 2024-2034
Last reviewed October 30, 2026. Startup costs are estimates; check local prices, licensing and tax rules before you commit money.

