
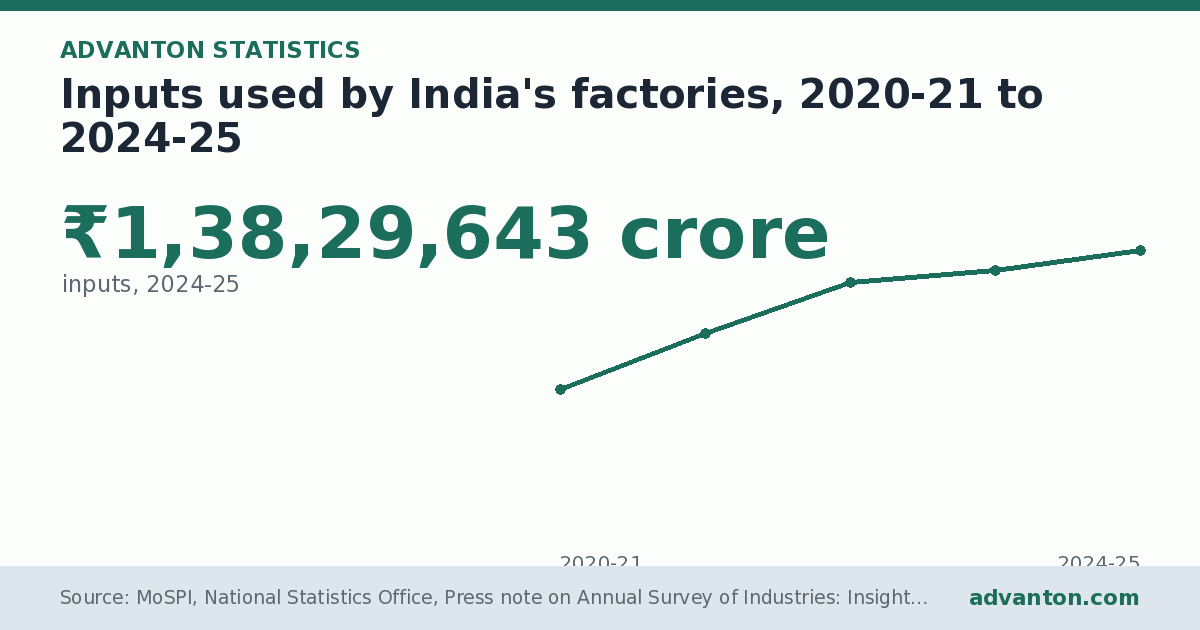
Inputs used by India's factories was ₹1,38,29,643 crore in 2024-25, 7.47% more than in 2023-24 and 92.3% more than in 2020-21.
Data last updated · Period: 2020-21 to 2024-25
Understanding the chart
The line chart above tracks inputs used by India's factories for each year from 2020-21 to 2024-25, 5 data points in all. Each dot is one year; the first and last years and the highest point are labelled with their values, and the vertical scale is in ₹ crore. All values in this period were above zero. The data table below the chart lists every value, and you can download the data, embed the chart or share it from the buttons above. The figures cover 2020-21 to 2024-25 and come from MoSPI, National Statistics Office, Press note on Annual Survey of Industries: Insights from ASI 2024-25 (30 September 2026), tables 1 to 3 and charts 1 and 2.
Key insights
- From 2020-21 to 2024-25 the figure moved from ₹71,92,065 crore to ₹1,38,29,643 crore, a change of 92.3%.
- The highest value was ₹1,38,29,643 crore (2024-25) and the lowest ₹71,92,065 crore (2020-21).
- The biggest single change came between 2020-21 and 2021-22 (+₹26,87,115 crore).
- The latest readings are the highest or level with the ones before, a rising recent trend.
Analysis
The value went up in 4 of the 4 year-to-year steps and down in 0. The biggest one-year rise came in 2021-22 (+₹26,87,115 crore, or 37.4%). Across the period the values varied by about 24% around their average (₹1,12,11,853 crore), a moderate amount of change.
What it means
Factory data show where India's manufacturing is concentrated and how fast it is growing. For a small business, large factory clusters mean customers for supplies, maintenance, transport, canteens and services, and a pool of skilled workers, but also competition for staff and rising wages. Value added per person and pay per person show how productive and well paid factory work is; comparing them with the small-business figures from ASUSE shows how much larger and more capital-intensive registered factories are than workshops and home-based units.
Related figures
- Value added per person engaged in India's factories, 2020-21 to 2024-25: ₹12,83,140 (GVA per person engaged, 2024-25 (computed)). Value added per person engaged was ₹12,83,140 in 2024-25, against ₹10,05,083 in 2020-21 (computed by Advanton from the official ASI totals).
- Average pay per person engaged in India's factories, 2020-21 to 2024-25: ₹3,82,451 (emoluments per person engaged, 2024-25 (computed)). Average pay per person engaged was ₹3,82,451 in 2024-25, against ₹3,00,745 in 2020-21 (computed by Advanton from the official ASI totals).
- Largest factory industries in India by employment, 2024-25: 23.6 lakh (persons engaged in food products). Food products is the largest employer among India's factory industries, with about 23.6 lakh people in 2024-25, followed by textiles (17.6 lakh) and basic metals (15.8 lakh).
About this statistic
The Annual Survey of Industries (ASI) is MoSPI's main source on India's registered manufacturing sector. It covers factories registered under the Factories Act, 1948, generally those with 10 or more workers using power or 20 or more without, plus bidi and cigar establishments, some electricity undertakings and larger units on state business registers. Data are collected from factory records through an online portal, under the Collection of Statistics Act.
Output is the value of everything a factory produces; inputs are the materials, fuel and services it buys; gross value added (GVA) is output minus inputs. Persons engaged include workers, supervisors, managers and unpaid proprietors; emoluments are all pay and benefits. Figures are in current prices, so part of the growth reflects inflation, and they are estimates from a sample survey. Small workshops outside the Factories Act are covered instead by the survey of unincorporated enterprises (ASUSE).
Questions and answers
What is the inputs used by India's factories?
₹1,38,29,643 crore (inputs, 2024-25). Inputs used by India's factories was ₹1,38,29,643 crore in 2024-25, 7.47% more than in 2023-24 and 92.3% more than in 2020-21.
How has it changed over time?
From 2020-21 to 2024-25 the figure moved from ₹71,92,065 crore to ₹1,38,29,643 crore, a change of 92.3%. The highest value was ₹1,38,29,643 crore (2024-25) and the lowest ₹71,92,065 crore (2020-21).
Where does this data come from?
From MoSPI, National Statistics Office, Press note on Annual Survey of Industries: Insights from ASI 2024-25 (30 September 2026), tables 1 to 3 and charts 1 and 2, covering 2020-21 to 2024-25. ASI covers factories registered under the Factories Act, 1948 (sections 2m(i) and 2m(ii)), bidi and cigar establishments, certain electricity undertakings and units with 100 or more employees in state business registers. Reference year April to March; figures in current prices, not adjusted for inflation; estimates from a sample survey.
How this page was made
Generated by Advanton from MoSPI, National Statistics Office, Press note on Annual Survey of Industries: Insights from ASI 2024-25 (2020-21 to 2024-25), data updated 10 November 2026: chart, ranks, comparisons and text are computed from the published figures; no figures are changed. Our methodology.
Data
| Year | Inputs (₹ crore) |
|---|---|
| 2020-21 | ₹71,92,065 crore |
| 2021-22 | ₹98,79,180 crore |
| 2022-23 | ₹1,22,89,546 crore |
| 2023-24 | ₹1,28,68,830 crore |
| 2024-25 | ₹1,38,29,643 crore |
Source and notes
Source: MoSPI, National Statistics Office, Press note on Annual Survey of Industries: Insights from ASI 2024-25 (30 September 2026), tables 1 to 3 and charts 1 and 2. Period: 2020-21 to 2024-25. Coverage: India.
ASI covers factories registered under the Factories Act, 1948 (sections 2m(i) and 2m(ii)), bidi and cigar establishments, certain electricity undertakings and units with 100 or more employees in state business registers. Reference year April to March; figures in current prices, not adjusted for inflation; estimates from a sample survey.
Cite this statistic
Formats, embedding and reuse: how to cite Advanton.
Please also credit the original source: MoSPI, National Statistics Office, Press note on Annual Survey of Industries: Insights from ASI 2024-25 (30 September 2026), tables 1 to 3 and charts 1 and 2.Related statistics
- Value added per person engaged in India's factories, 2020-21 to 2024-25
- Average pay per person engaged in India's factories, 2020-21 to 2024-25
- Largest factory industries in India by employment, 2024-25
- States with the largest share of India's factory value added, 2024-25
- Total pay of factory employees in India (emoluments), 2020-21 to 2024-25
Need more detail? Build a free India market report for any business and state.
Last reviewed November 9, 2026. Startup costs are estimates; check local prices, licensing and tax rules before you commit money.

