• Skip to primary navigation
  • Skip to main content
  • Skip to footer
advanton usa logo

Advanton

  • Data
    • Ask and find
      • Find answersCommon questions answered with official data
      • Ask AdvantonAsk a question in plain words
      • All statistics8,700+ statistics, searchable
      • Your state or countryHow any place ranks on every measure
      • Compare 217 countriesWorld data explorer
    • Topics
      • India consumer spending
      • India GST by state
      • India population
      • US consumer spending
      • US markets and e-commerce
      • World economy
    • Industries
      • Industry statisticsKey figures for 12 industries
      • US industry dataProfiles of US industries
      • Market size estimates200 business types in India
      • Indian small businesses
      • India’s factories
      • US industries and jobs
    • Stories and methods
      • Data storiesSurprising findings, checked against sources
      • Charts
      • MethodologyHow every figure is made
      • How to citeCredit and link the source
  • Market Research
    • Market report builderA market overview for any business and state
    • Test your business ideaCheck an idea against real data
    • Advanton ReportsOriginal research on consumers and small businesses
    • How to calculate market sizeTAM, SAM and SOM with worked examples
    • Market research for small businessA step-by-step guide
    • Free market data: IndiaOfficial Indian sources and how to use them
    • Free market data: USUS government data for market research
    • All market research guides
  • Start & Grow
    • Start a business
      • How to start a business, A to Z
      • Business ideas
      • Choosing a business structure
      • Get an EIN
      • SBA loans
      • Small business grants
      • Business banking
      • Franchises
      • Guides for Indian businesses
    • Grow your business
      • Hiring your first employee
      • Taxes and bookkeeping
      • Keeping customers
      • Financing growth
      • Using AI
      • Services owners use
    • Free tools
      • Start tools
      • Launch tools
      • Market tools
      • Grow tools
      • All free tools
    • Contractors
      • Contractor website builderWebsites for 8 trades, 5 designs each
      • Websites by trade
      • Yard signs and door hangersYard signs and door hangers with a QR code
      • Marketing for contractors
      • Angi vs Thumbtack
  • Directory
    • Browse US businessesFind local small businesses
    • Browse Indian businesses
    • List a US businessA free listing in the directory
    • List an Indian businessA free listing in the directory
    • US local deals
    • India local deals
    • Business owner login
  • Who it’s for
    • SEO agencies and consultantsCite, embed and download data for clients
    • Founders and startupsValidate an idea and size the market
    • Loan applicationsMarket data lenders trust
    • Students and researchersSourced data you can cite
    • JournalistsQuotable findings and how to credit them
  • Get Online
    • Launch your business onlineDomain, website and hosting, step by step
    • Free website builderA free website in about 10 minutes
    • Contractor website builderWebsites for 8 trades, 5 designs each
    • Local SEO CheckSee what to fix to rank in local search
    • Domains & hosting
  • Or browse Find answers: common questions answered with official data.

  • My account
Home » Earnings and Unemployment by Education Level, 2025

Earnings and Unemployment by Education Level, 2025

November 16, 2026

Key figures, 2025 (full-time workers age 25 and over)

  • Bachelor’s degree: $1,578 a week; high school diploma: $966. The difference is about $31,800 a year.
  • Doctoral degree: $2,307 a week, the highest; less than high school: $770, the lowest.
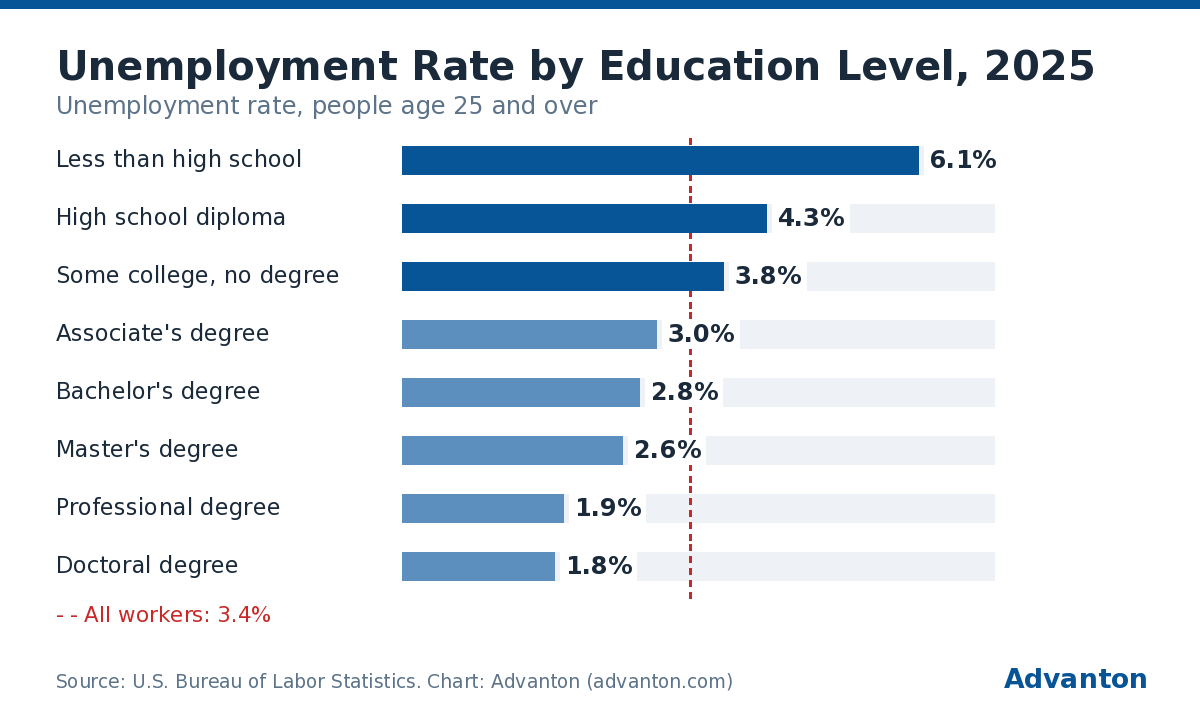
  • Unemployment falls with every step of education: from 6.1% without a high school diploma to 1.8% with a doctorate.
  • All workers: $1,268 a week median, 3.4% unemployment.

Earnings by education level follow a clear pattern: pay rises and unemployment falls with each step, according to the Bureau of Labor Statistics. In 2025, a full-time worker with a bachelor’s degree typically earned $1,578 a week, 63% more than one with only a high school diploma ($966).

Data: U.S. Bureau of Labor Statistics, "Education pays, 2025" (Career Outlook, September 2026), from the Current Population Survey. Updated each year.

Weekly pay by education

Table of Contents

  • Weekly pay by education
  • Weekly pay by education level, 2025
  • Cite this chart
  • Embed this chart
  • Unemployment by education
  • Unemployment rate by education level, 2025
  • Cite this chart
  • Embed this chart
  • A degree isn’t the only route
  • Understanding the numbers
    • "Median weekly earnings" explained
    • The pay gap at each step
    • Unemployment: the other half of the story
    • Correlation, not a guarantee
    • Why 2025 needs a footnote
  • How to use this data
  • Frequently asked questions
  • About the data
  • Use these charts

Weekly pay by education level, 2025

Median usual weekly earnings, full-time wage and salary workers age 25 and over

ImageData (CSV)
Doctoral degree$2,307
Professional degree$2,294
Master's degree$1,876
Bachelor's degree$1,578
Associate's degree$1,135
Some college, no degree$1,062
High school diploma$966
Less than high school$770

All workers: $1,268

Source: U.S. Bureau of Labor Statistics, Career Outlook: Education pays, 2025 (Current Population Survey; full-time wage and salary workers age 25 and over). Chart by Advanton. More data and charts.

Cite this chart

Pick a style, then copy. Please link to the chart page so readers can see the full data.

Embed this chart

Free to use on your website or blog. Paste the code where you want the chart. Please keep the credit line.

"Auto height" sizes the chart to fit. Some website builders remove scripts; use "Without script" there.

Preview
Education Median weekly earnings About per year (× 52) Unemployment rate
Doctoral degree $2,307 $119,964 1.8%
Professional degree $2,294 $119,288 1.9%
Master’s degree $1,876 $97,552 2.6%
Bachelor’s degree $1,578 $82,056 2.8%
Associate’s degree $1,135 $59,020 3.0%
Some college, no degree $1,062 $55,224 3.8%
High school diploma $966 $50,232 4.3%
Less than a high school diploma $770 $40,040 6.1%
All workers $1,268 $65,936 3.4%

Yearly figures multiply the weekly median by 52 for illustration; BLS publishes weekly medians.

Unemployment by education

Unemployment rate by education level, 2025

Unemployment rate, people age 25 and over
ImageData (CSV)
Less than high school6.1%
High school diploma4.3%
Some college, no degree3.8%
Associate's degree3.0%
Bachelor's degree2.8%
Master's degree2.6%
Professional degree1.9%
Doctoral degree1.8%

All workers: 3.4%

Source: U.S. Bureau of Labor Statistics, Career Outlook: Education pays, 2025 (Current Population Survey; full-time wage and salary workers age 25 and over). Chart by Advanton. More data and charts.

Cite this chart

Pick a style, then copy. Please link to the chart page so readers can see the full data.

Embed this chart

Free to use on your website or blog. Paste the code where you want the chart. Please keep the credit line.

"Auto height" sizes the chart to fit. Some website builders remove scripts; use "Without script" there.

Preview

People without a high school diploma were more than three times as likely to be unemployed as those with a doctorate (6.1% vs 1.8%).

A degree isn’t the only route

Several skilled trades pay well without a four-year degree. Electricians, for example, earned a median $63,190 in May 2025, and BLS projects their employment to grow 9% from 2025 to 2035, much faster than average (BLS Occupational Outlook Handbook). See more in our guide What is a career?

Understanding the numbers

"Median weekly earnings" explained

The median is the middle value: half of full-time workers at each education level earn more, half earn less. It is less affected than an average by a few very high earners. The figures are usual weekly earnings before taxes for people who work full time for an employer; self-employed people are not included.

The pay gap at each step

Step up Extra weekly pay Extra per year (× 52)
Less than high school → high school diploma +$196 +$10,192
High school → some college, no degree +$96 +$4,992
Some college → associate’s degree +$73 +$3,796
Associate’s → bachelor’s degree +$443 +$23,036
Bachelor’s → master’s degree +$298 +$15,496
Master’s → doctoral degree +$431 +$22,412

The largest single jump is from an associate’s to a bachelor’s degree. Starting college without finishing adds the least.

Unemployment: the other half of the story

Pay is only part of the picture. The chance of being unemployed falls at every level, from 6.1% for people without a high school diploma to 1.8% with a doctorate. More education tends to mean both higher pay and steadier work.

Correlation, not a guarantee

These are averages across millions of workers. People who complete more education also differ in other ways, such as the fields they choose, where they live and their experience, so the figures show how pay differs by education, not exactly what any one person would earn by studying further. Field matters a lot: a high-demand trade can out-earn some degrees.

Why 2025 needs a footnote

The October 2025 federal government shutdown stopped data collection for that month, so BLS’s 2025 annual figures average 11 months. BLS says they are not strictly comparable with other years, so small year-to-year changes should not be over-read.

How to use this data

  • Students and parents: compare the pay and unemployment of each level with the time and cost of getting there. Look up specific occupations in the BLS Occupational Outlook Handbook.
  • Career changers: an associate’s degree, apprenticeship or certificate in a high-demand field can be a faster route to higher pay than a general degree.
  • Employers: use the medians as a starting benchmark when setting pay for roles that require each level of education. See what employees want from a job offer.

Frequently asked questions

How much more does a bachelor’s degree earn than a high school diploma?
In 2025, full-time workers age 25 and over with a bachelor’s degree had median weekly earnings of $1,578, against $966 for high school graduates: $612 more a week, about $31,800 a year.

Which education level earns the most?
Doctoral degree holders ($2,307 a week), just ahead of professional degree holders such as doctors and lawyers ($2,294).

What is the unemployment rate for college graduates?
2.8% for people with a bachelor’s degree in 2025, against 4.3% for high school graduates and 3.4% for all workers.

About the data

  • Source: BLS Current Population Survey, as published in "Education pays, 2025".
  • Who is counted: people age 25 and over; earnings are for full-time wage and salary workers.
  • 2025 caveat: annual averages are based on 11 months because October 2025 data were not collected during the federal government shutdown, so BLS says they are not strictly comparable with other years.
  • Medians, not averages: half of workers earn more and half less.

Use these charts

Cite or embed either chart free with the buttons above each one. Please keep the credit link.

Last reviewed November 17, 2026. Startup costs are estimates; check local prices, licensing and tax rules before you commit money.

Advanton presents official data as easy-to-read charts and figures. The figures on this page come from the sources named with each statistic and chart, and those sources may revise them. This page is general information, not financial or investment advice. See our disclaimer.

Keep reading

  • Best States to Start an Auto Repair Shop: All 50 States Ranked
  • Best States to Start a Cleaning Business: All 50 States Ranked
  • Best States to Start a Childcare Business: All 50 States Ranked
  • Best States to Start a Home Care Business: All 50 States Ranked

Share this guide

Filed Under: Data Stories Tagged With: BLS, earnings, education, unemployment, United States

Local SEO Check Free: scan your website and see what to fix to rank in local search →

Data

  • Statistics
  • Data and charts
  • Find answers
  • Your state or country
  • Industry statistics
  • Data stories
  • Compare 217 countries
  • Methodology

Start and grow

  • Start a business, A to Z
  • Business ideas
  • LLC by state
  • Industry data
  • USPS for small business
  • Grow your business
  • Google Business Profile guide
  • Online marketing guide

Free tools

  • Website builder
  • Local SEO Check
  • Business Planner
  • Quotes and invoices
  • Rewards program
  • Brand & Print Studio
  • All free tools

Get online

  • Launch your business online
  • Domains and hosting
  • Verify your new domain
  • Upload your website
  • Set up business email
  • For contractors

Advanton

  • About
  • How it works
  • Contact
  • Business directory
  • Add your business
  • The Advanton opportunity
  • Privacy policy
  • Terms of use
  • Disclaimer

Advanton Free market data, guides and tools for small businesses in the US, India and worldwide.

Advanton earns money when you buy a domain or hosting through our store. It helps keep our guides and tools free.

Footer

About ADVANTON

Free guides and tools that help small businesses start, launch online, find customers and grow.

Copyright © 2026 — ADVANTON • All rights reserved. • Privacy Policy

Expand · Multiply · Grow

Your next customer is already here.

Thousands of business owners use Advanton every month. Put your products and services in front of them.

Feature it in a Display Popup or a Sponsored Post

Get discovered