• Skip to primary navigation
  • Skip to main content
  • Skip to footer
advanton usa logo

Advanton USA

  • Statistics
    • All statistics
    • Ask Advanton
    • India consumer spending
    • India GST by state
    • India population
    • US consumer spending
    • US markets and e-commerce
    • World economy
    • Compare 217 countries
    • Charts
    • About the data
  • Industries
    • US industry data
    • Market size estimates
    • Indian small businesses
    • India’s factories
    • US industries and jobs
  • Reports
    • India market report builderBuild a market report for any business in India
    • Test your business ideaTest your idea with real industry data
  • Tools
    • Start
      • Business Idea Reality CheckTest your idea with real industry data
      • Business PlannerName, costs, pricing and a one-page plan
      • India Market Report BuilderBuild a market report for any business in India
    • Launch
      • Launch your business onlineDomain, website and hosting, step by step
      • Brand & Print StudioCards, flyers, postcards, signs and more
      • Website builderA free website in about 10 minutes
    • Market
      • Marketing HubOnline presence, reviews and lead tracking
      • Local SEO checkerScan your site and fix local rankings
    • Grow
      • Quotes and invoicesProfessional quotes and invoices
      • Cash & Payroll PlannerCash flow, hiring costs and unpaid invoices
      • Mileage logBusiness miles at the 2026 IRS rate
      • Rewards programStamp cards that bring customers back
      • Word to PDFConvert Word documents to PDF
      • Business credit card finder
    • Local SEO CheckScan your site and fix local rankings
      • Scan your websiteScan your site and fix local rankings
      • Plan service and town pagesScan your site and fix local rankings
      • Generate LocalBusiness schemaScan your site and fix local rankings
      • Business Profile checklistScan your site and fix local rankings
      • Compare with competitorsScan your site and fix local rankings
      • Learn the ranking factorsScan your site and fix local rankings
    • Domains & hosting
  • Guides
    • Start a business
      • How to start a business, A to Z
      • Business ideas
      • Test your business ideaTest your idea with real industry data
      • Choosing a business structure
      • Get an EIN
      • SBA loans
      • Small business grants
      • Business banking
      • Franchises
    • Grow your business
      • Hiring your first employee
      • Taxes and bookkeeping
      • Keeping customers
      • Financing growth
      • Using AI
      • Services owners use
    • Contractors
      • Contractor website builderWebsites for 8 trades, 5 designs each
      • Websites by trade
      • Yard signs and door hangersYard signs and door hangers with a QR code
      • Marketing for contractors
      • Angi vs Thumbtack
    • Guides for Indian businesses
  • Directory
    • Browse US businessesFind local small businesses
    • Browse Indian businesses
    • List a US businessA free listing in the directory
    • List an Indian businessA free listing in the directory
    • US local deals
    • India local deals
    • Guides for Indian businesses
    • Business owner login
  • Get Online
    • Launch your business onlineDomain, website and hosting, step by step
    • Free website builderA free website in about 10 minutes
    • Contractor website builderWebsites for 8 trades, 5 designs each
    • Domains & hosting
  • My account
Home » Statistics

Share of people living in cities in Croatia, 2010–2025

Statistics › World population
57.8%Urban population, 2025 · 135th of 217

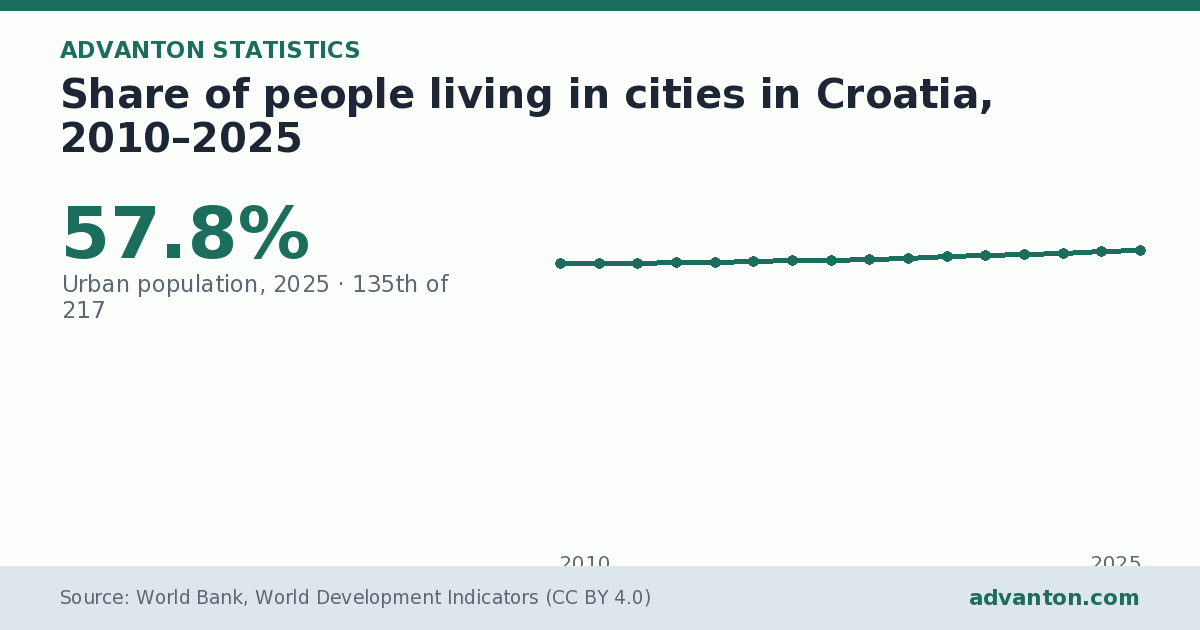
Share of people living in cities in Croatia: 57.8% in 2025, ranking 135th of 217 countries. In 2010 it was 55.3%.

Data last updated 8 November 2026 · Period: 2010–2025

2010: 55.3%55.3%20102011: 55.3%2012: 55.3%2013: 55.4%20132014: 55.5%2015: 55.6%2016: 55.7%20162017: 55.9%2018: 56.1%2019: 56.3%20192020: 56.5%2021: 56.8%2022: 57.0%20222023: 57.2%2024: 57.5%2025: 57.8%57.8%2025Source: World Bank, World Development Indicators (CC BY 4.0) · advanton.com
Share of people living in cities in Croatia, 2010–2025
Excel PowerPoint CSV PNG Free account: 2 free downloads (Excel, PowerPoint, CSV or PNG). Each download unlocks that statistic in every format.

Understanding the chart

The line chart above tracks share of people living in cities in Croatia for each year from 2010 to 2025, 16 data points in all. Each dot is one year; the first and last years and the highest point are labelled with their values, and the vertical scale is in % of total. All values in this period were above zero. The data table below the chart lists every value, and you can download the data, embed the chart or share it from the buttons above. The figures cover 2010–2025 and come from World Bank, World Development Indicators (CC BY 4.0).

Key insights

  • Between 2010 and 2025, Croatia's urban population rose from 55.3% to 57.8%, a rise of 2.5 percentage points.
  • The highest value in this period was 57.8% in 2025; the lowest was 55.3% in 2011.
  • Recently, the figure has risen in each of the last two years (2024: 57.5%; 2025: 57.8%).
  • That is 0.0 percentage points below the world figure of 57.8%.
  • Croatia has the 135th-highest value of 217 countries with recent data.
  • In Southern Europe, Croatia has the 13th-highest value of 16 countries with recent data; the highest is Gibraltar (100.0%), and the typical (median) value is 64.3%.

Analysis

Averaged over periods, the figure was 55.3% in 2010 to 2014, 55.9% in 2015 to 2019 and 57.1% in 2020 onwards. The value went up in 14 of the 15 year-to-year steps and down in 1. The biggest one-year rise came in 2025 (+0.3 percentage points). The biggest one-year fall came in 2011 (−0.0 percentage points). Year to year, the figure typically varied by about 0.9 percentage points around its average of 56.2%, a stable pattern.

Croatia and its neighbours

Urban population (% of total) among 16 countries in Southern Europe with recent data, ranked from highest to lowest.

Rank in regionCountryValueYear
10Serbia62.6%2025
11Portugal61.5%2025
12Albania58.9%2025
13Croatia57.8%2025
14Slovenia56.0%2025
15Bosnia and Herzegovina52.7%2025
16Kosovo50.9%2025

Croatia on related measures

  • Population: 3.9 million (2025, 130th-highest of 217 countries)
  • Population growth (annual %): 0.26% (2025, 156th-highest of 217 countries)
  • Population density (people per sq. km): 69.0 (2023, 136th-highest of 216 countries)
  • Population aged 0 to 14 (% of total): 13.7% (2025, 202nd-highest of 217 countries)
  • Population aged 15 to 64 (% of total): 62.7% (2025, 141st-highest of 217 countries)

Global position: Croatia's figure is higher than 38% of the 217 countries with data for this measure.

What it means

For businesses and investors, the figure is most useful alongside related measures for the same country, such as growth, inflation, population and incomes, and compared with similar countries. Compared with its neighbours in Southern Europe, where the typical value is 64.3%, Croatia is 6.4 percentage points lower.

About this statistic

The share of people living in areas defined as urban by each country. Source: World Bank, World Development Indicators.

For the full definition, caveats and every country ranked, see Urban population (% of total) by country, 2025.

Questions and answers

What is the share of people living in cities in Croatia?

57.8% (Urban population, 2025 · 135th of 217). Share of people living in cities in Croatia: 57.8% in 2025, ranking 135th of 217 countries. In 2010 it was 55.3%.

How has urban population in Croatia changed since 2010?

Between 2010 and 2025, Croatia's urban population rose from 55.3% to 57.8%, a rise of 2.5 percentage points. The highest value in this period was 57.8% in 2025; the lowest was 55.3% in 2011.

How this page was made

Generated by Advanton from World Bank, World Development Indicators (2010–2025), data updated 8 November 2026: chart, ranks, comparisons and text are computed from the published figures; no figures are changed. About the data.
Share of people living in cities in Croatia: 57.8% (Urban population, 2025 · 135th of 217), chart
Chart image: Share of people living in cities in Croatia, 2010–2025. Free to share with a link to this page.

Data

YearUrban population (% of total)
201055.3%
201155.3%
201255.3%
201355.4%
201455.5%
201555.6%
201655.7%
201755.9%
201856.1%
201956.3%
202056.5%
202156.8%
202257.0%
202357.2%
202457.5%
202557.8%

Source and notes

Source: World Bank, World Development Indicators (CC BY 4.0). Period: 2010–2025. Coverage: Croatia.

The share of people living in areas defined as urban by each country. City dwellers are usually easier and cheaper to reach with deliveries, shops and services.

Cite this statistic

Please also credit the original source: World Bank, World Development Indicators (CC BY 4.0).

Related statistics

  • Urban population (% of total) by country, 2025
  • Share of people living in cities in Albania, 2010–2025
  • Share of people living in cities in Andorra, 2010–2025
  • Share of people living in cities in Bosnia and Herzegovina, 2010–2025
  • Share of people living in cities in Spain, 2010–2025
  • GDP of Croatia, 2010–2025
  • Economic growth (GDP growth) in Croatia, 2010–2025
  • GDP per person in Croatia, 2010–2025
  • GDP per person, adjusted for prices (PPP, international $) in Croatia, 2010–2024

All Croatia data: economy, people, jobs and digital in one place

Need more detail? Build a free India market report for any business and state.

Last reviewed November 9, 2026. Startup costs are estimates; check local prices, licensing and tax rules before you commit money.

Local SEO Check Free: scan your website and see what to fix to rank in local search →

Start and grow

  • Start a business, A to Z
  • Industry data
  • Compare 217 countries
  • Services owners use
  • Grow your business

Free tools

  • Website builder
  • Local SEO Check
  • Business Planner
  • Quotes and invoices
  • Rewards program
  • Brand & Print Studio
  • All free tools

Get online

  • Launch your business online
  • Domains and hosting
  • Verify your new domain
  • Upload your website
  • Set up business email
  • For contractors

Advanton

  • About
  • Contact
  • Business directory
  • Add your business
  • Sponsored posts
  • Back up your work
  • Privacy policy

Advanton Free guides and tools for US small businesses.

Advanton earns money when you buy a domain or hosting through our store. It helps keep our guides and tools free.

Footer

About ADVANTON

Free guides and tools that help small businesses start, launch online, find customers and grow.

Follow us

  • facebook
  • twitter
  • yelp

Our Associations

Contact Us

Email: info[at]advanton.com

From rest of the world, email us: info[at]advanton.com

Copyright © 2026 — ADVANTON • All rights reserved. • Privacy Policy

  • Statistics
  • Industries
  • Reports
  • Tools
  • Guides
  • Directory
  • Get Online
  • My account

Expand · Multiply · Grow

Your next customer is already here.

Thousands of business owners use Advanton every month. Put your products and services in front of them.

Feature it in a Display Popup or a Sponsored Post

Get discovered