
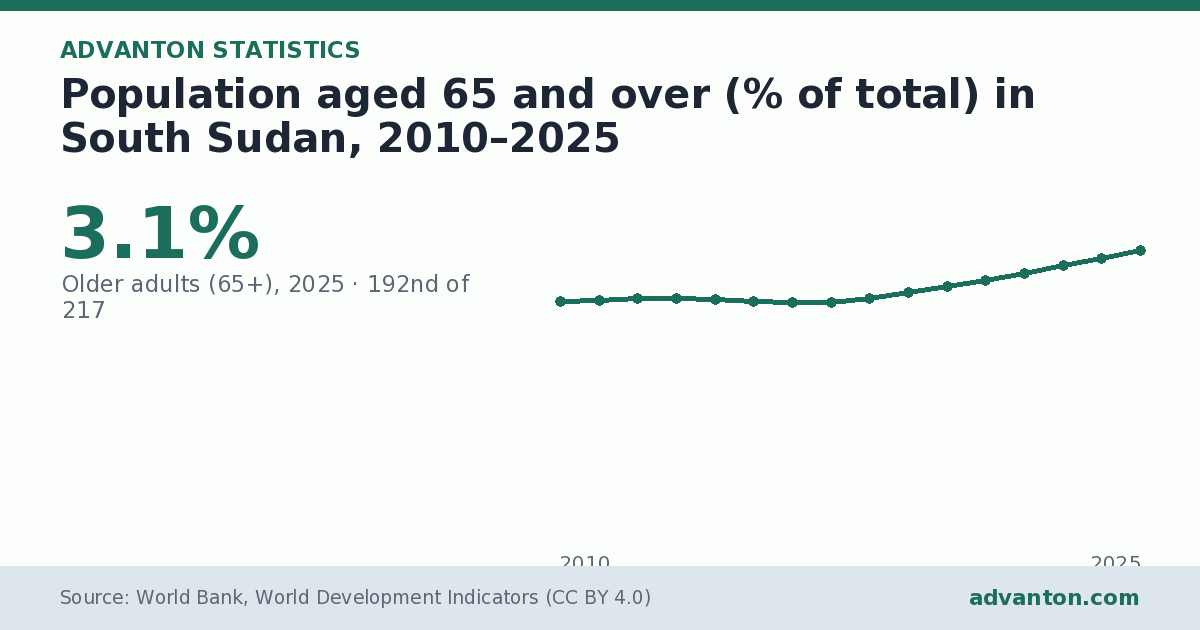
Population aged 65 and over in South Sudan: 3.1% (Older adults, 65+, 2025 · 192nd of 217). Population aged 65 and over (% of total) in South Sudan: 3.1% in 2025, ranking 192nd of 217 countries. In 2010 it was 2.5%.
Data last updated · Period: 2010–2025
Understanding the chart
The line chart above tracks population aged 65 and over (% of total) in South Sudan for each year from 2010 to 2025, 16 data points in all. Each dot is one year; the first and last years and the highest point are labelled with their values, and the vertical scale is in % of total. All values in this period were above zero. The data table below the chart lists every value, and you can download the data, embed the chart or share it from the buttons above. The figures cover 2010–2025 and come from World Bank, World Development Indicators (CC BY 4.0).
Key insights
- Between 2010 and 2025, South Sudan's older adults (65+) rose from 2.5% to 3.1%, a rise of 0.5 percentage points.
- The highest value in this period was 3.1% in 2025; the lowest was 2.5% in 2016.
- Recently, the figure has risen in each of the last two years (2024: 3.0%; 2025: 3.1%).
- That is 7.3 percentage points below the world figure of 10.4%.
- South Sudan has the 192nd-highest value of 217 countries with recent data.
- In Eastern Africa, South Sudan has the 10th-highest value of 18 countries with recent data; the highest is Mauritius (14.1%), and the typical (median) value is 3.2%.
Analysis
Averaged over periods, the figure was 2.6% in 2010 to 2014, 2.6% in 2015 to 2019 and 2.9% in 2020 onwards. The value went up in 12 of the 15 year-to-year steps and down in 3. The biggest one-year rise came in 2025 (+0.1 percentage points). The biggest one-year fall came in 2015 (−0.0 percentage points). Year to year, the figure typically varied by about 0.2 percentage points around its average of 2.7%, a stable pattern.
South Sudan and its neighbours
Population aged 65 and over (% of total) among 18 countries in Eastern Africa with recent data, ranked from highest to lowest.
| Rank in region | Country | Value | Year |
|---|---|---|---|
| 7 | Zimbabwe | 3.6% | 2025 |
| 8 | Madagascar | 3.5% | 2025 |
| 9 | Ethiopia | 3.3% | 2025 |
| 10 | South Sudan | 3.1% | 2025 |
| 11 | Tanzania | 3.0% | 2025 |
| 12 | Kenya | 3.0% | 2025 |
| 13 | Mozambique | 2.7% | 2025 |
South Sudan on related measures
- Population: 12.2 million (2025, 80th-highest of 217 countries)
- Population growth (annual %): 2.03% (2025, 48th-highest of 217 countries)
- Urban population (% of total): 21.7% (2025, 210th-highest of 217 countries)
- Population density (people per sq. km): 18.2 (2023, 190th-highest of 216 countries)
- Population aged 0 to 14 (% of total): 38.0% (2025, 33rd-highest of 217 countries)
Global position: South Sudan's figure is higher than 12% of the 217 countries with data for this measure.
What it means
For businesses and investors, the figure is most useful alongside related measures for the same country, such as growth, inflation, population and incomes, and compared with similar countries. Compared with its neighbours in Eastern Africa, where the typical value is 3.2%, South Sudan is close to the regional norm.
About this statistic
The share of the population aged 65 or older. Source: World Bank, World Development Indicators.
For the full definition, caveats and every country ranked, see Population aged 65 and over (% of total) by country, 2025.
Questions and answers
What is the population aged 65 and over (% of total) in South Sudan?
3.1% (Older adults (65+), 2025 · 192nd of 217). Population aged 65 and over (% of total) in South Sudan: 3.1% in 2025, ranking 192nd of 217 countries. In 2010 it was 2.5%.
How has older adults (65+) in South Sudan changed since 2010?
Between 2010 and 2025, South Sudan's older adults (65+) rose from 2.5% to 3.1%, a rise of 0.5 percentage points. The highest value in this period was 3.1% in 2025; the lowest was 2.5% in 2016.
How this page was made
Generated by Advanton from World Bank, World Development Indicators (2010–2025), data updated 8 November 2026: chart, ranks, comparisons and text are computed from the published figures; no figures are changed. About the data.
Data
| Year | Population aged 65 and over (% of total) |
|---|---|
| 2010 | 2.5% |
| 2011 | 2.6% |
| 2012 | 2.6% |
| 2013 | 2.6% |
| 2014 | 2.6% |
| 2015 | 2.5% |
| 2016 | 2.5% |
| 2017 | 2.5% |
| 2018 | 2.6% |
| 2019 | 2.6% |
| 2020 | 2.7% |
| 2021 | 2.8% |
| 2022 | 2.8% |
| 2023 | 2.9% |
| 2024 | 3.0% |
| 2025 | 3.1% |
Source and notes
Source: World Bank, World Development Indicators (CC BY 4.0). Period: 2010–2025. Coverage: South Sudan.
The share of the population aged 65 or older. Ageing populations create growing demand for health care, home care, accessibility and leisure services.
Cite this statistic
Please also credit the original source: World Bank, World Development Indicators (CC BY 4.0).Related statistics
- Population aged 65 and over (% of total) by country, 2025
- Population aged 65 and over (% of total) in Burundi, 2010–2025
- Population aged 65 and over (% of total) in Comoros, 2010–2025
- Population aged 65 and over (% of total) in Djibouti, 2010–2025
- Population aged 65 and over (% of total) in Eritrea, 2010–2025
- Inflation rate in South Sudan, 2010–2024
- Lending interest rate (%) in South Sudan, 2012–2025
- Real interest rate (%) in South Sudan, 2012–2025
- Official exchange rate (local currency per US$, annual average) in South Sudan, 2011–2024
All South Sudan data: economy, people, jobs and digital in one place
Need more detail? Build a free India market report for any business and state.
Last reviewed November 9, 2026. Startup costs are estimates; check local prices, licensing and tax rules before you commit money.

