
Farmers market and festival food vendors market size: ₹2,02,872 crore (household spending a year on cooked snacks bought, estimate). Indian households spend an estimated ₹2,02,872 crore a year on cooked snacks bought (samosa, dosa, momos, rolls and similar), about 22% of the wider ₹9,12,100 crore pool they belong to.
Understanding the chart
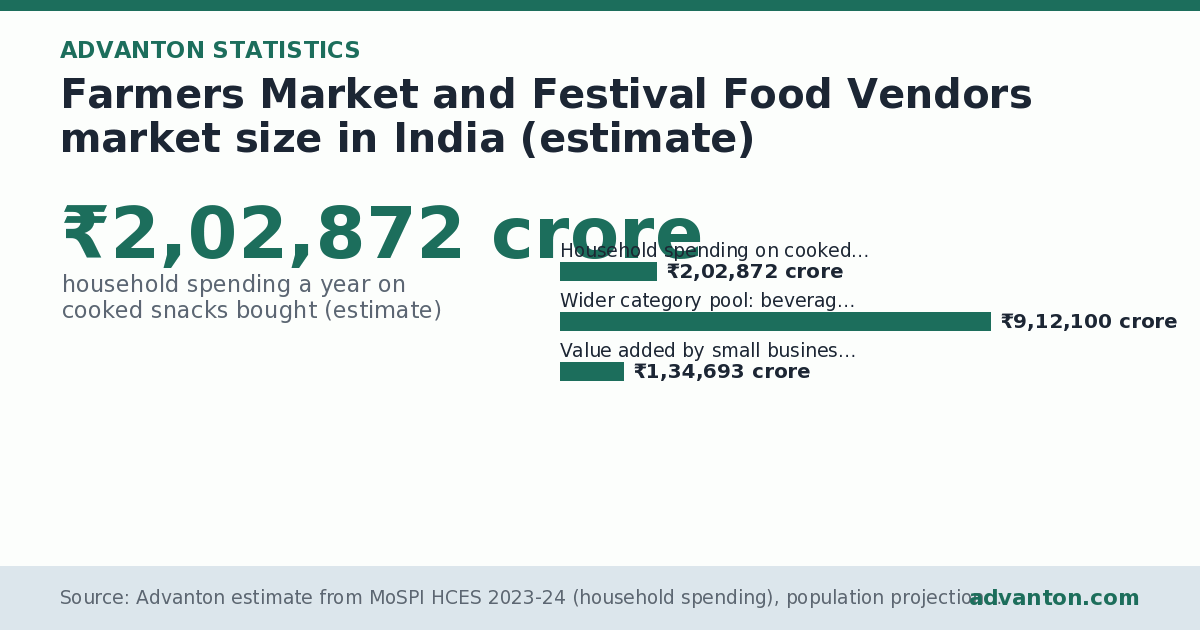
The bar chart above shows farmers Market and Festival Food Vendors market size in India (estimate), with one bar for each of the 3 figures. Each bar is labelled with its exact value, and values are estimate. The longest bar is the highest. The bars are, in order: Household spending on cooked snacks bought at ₹2,02,872 crore; Wider category pool: beverages, refreshments and processed food at ₹9,12,100 crore; Value added by small businesses: food and beverage service at ₹1,34,693 crore. The data table below the chart lists every value, and you can download the data, embed the chart or share it from the buttons above. The figures cover 2023-24 survey data, 2025 population and come from Advanton estimate from MoSPI HCES 2023-24 (household spending), population projections for 2025 and MoSPI ASUSE 2023-24 (unincorporated enterprises).
Key insights
- This is the whole spending pool for these categories, which farmers market and festival food vendors share with other kinds of businesses and sellers; the part spent with farmers market and festival food vendors alone is a fraction of it.
- That is 2.3% of all Indian household spending (about ₹87,24,460 crore a year).
- Urban households account for 50% of it (₹1,01,783 crore) and rural households 50% (₹1,01,088 crore).
- Per person, that is about ₹1,438 a year, or ₹120 a month.
- The largest state markets are Uttar Pradesh (₹26,237 crore), Maharashtra (₹20,674 crore), Tamil Nadu (₹15,332 crore), Bihar (₹13,727 crore), West Bengal (₹12,372 crore) (estimates).
- On the supply side, India has about 37 lakh small unincorporated businesses in food and beverage service, adding ₹3,63,984 of value a year on average (urban ₹4,77,219, rural ₹2,39,374).
Analysis
Household spending on cooked snacks bought (₹2,02,872 crore) is 78% lower than Wider category pool: beverages, refreshments and processed food (₹9,12,100 crore), a difference of ₹7,09,228 crore. Household spending on cooked snacks bought (₹2,02,872 crore) is 51% higher than Value added by small businesses: food and beverage service (₹1,34,693 crore), a difference of ₹68,179 crore. Across the 3 bars, the highest is Wider category pool: beverages, refreshments and processed food and the lowest is Value added by small businesses: food and beverage service.
What it means
A market size estimate answers the first question in any business plan: is there enough spending to support another business? Use it as a ceiling, then narrow down. Take your town or district's share of the state market (roughly its share of the state's population, adjusted for whether it is urban or rural), think about how many competitors already share that spending, and estimate the realistic share you could win in your first years. Lenders and investors look for exactly this reasoning, and the method and sources on this page can be cited in a business plan or loan application.
Related figures
- What people in urban India spend on each month, by category, 2023-24: ₹6,996 (total per person a month). Of ₹6,996 spent per person a month in urban India, the biggest category is beverages, refreshments and processed food (₹776), followed by conveyance (₹592).
- Food and beverage service (restaurants, dhabas, caterers, cafes, stalls) in India: number of small businesses and earnings, 2023-24: 37 lakh (small unincorporated businesses). India has about 37 lakh small unincorporated businesses in food and beverage service (restaurants, dhabas, caterers, cafes, stalls), 52.4% of them urban.
- Size of India's household spending markets by category (estimate): ₹87,24,460 crore (all household spending a year (estimate)). Indian households spend an estimated ₹87,24,460 crore a year.
The story behind this number
India’s Snack Economy: About ₹2 Lakh Crore a Year on Samosas, Dosas and MoreIndian households spend about ₹2,02,872 crore a year on cooked snacks bought outside, 65% more than on full meals bought, split almost evenly between towns and villages.
Starting this business?
About this statistic
Advanton estimates market size in two transparent ways. Demand side: the monthly amount a person spends on the household spending categories this business sells into (MoSPI's Household Consumption Expenditure Survey 2023-24, separately for urban and rural India) multiplied by the projected 2025 urban and rural population and by 12. This is the whole category's spending, so it is the pool this business competes for, not what any one type of business earns. Supply side: the number of small unincorporated businesses in the related survey activity multiplied by their average gross value added a year (MoSPI's ASUSE 2023-24), which shows how much value small businesses already produce. Companies and larger registered firms are not included.
Both figures are in current prices from different survey years, so treat them as orders of magnitude, not exact market sizes. Household surveys also capture less spending than India's national accounts (private final consumption expenditure), often around half, so the demand estimates are conservative. Business-to-business types show only the supply side, because household spending does not measure their customers. State figures scale India's category spending by each state's overall spending level and population.
Questions and answers
What is the farmers Market and Festival Food Vendors market size in India (estimate)?
₹2,02,872 crore (household spending a year on cooked snacks bought (estimate)). Indian households spend an estimated ₹2,02,872 crore a year on cooked snacks bought (samosa, dosa, momos, rolls and similar), about 22% of the wider ₹9,12,100 crore pool they belong to.
How does India compare?
This is the whole spending pool for these categories, which farmers market and festival food vendors share with other kinds of businesses and sellers; the part spent with farmers market and festival food vendors alone is a fraction of it. That is 2.3% of all Indian household spending (about ₹87,24,460 crore a year).
Where does this data come from?
From Advanton estimate from MoSPI HCES 2023-24 (household spending), population projections for 2025 and MoSPI ASUSE 2023-24 (unincorporated enterprises), covering 2023-24 survey data, 2025 population. Demand side: monthly spending per person on each category (HCES 2023-24, urban and rural) × projected 2025 urban and rural population × 12. Supply side: number of unincorporated businesses in the activity × average gross value added per business (ASUSE 2023-24, urban and rural). Figures in current prices; the survey years differ from the population year, so treat the result as an order of magnitude.
How this page was made
Generated by Advanton from Advanton estimate from MoSPI HCES 2023-24 (2023-24 survey data, 2025 population): chart, ranks, comparisons and text are computed from the published figures; estimates are Advanton's, with the method shown. Our methodology.
Data
| Measure (₹ crore a year) | Estimate |
|---|---|
| Household spending on cooked snacks bought | ₹2,02,872 crore |
| Wider category pool: beverages, refreshments and processed food | ₹9,12,100 crore |
| Value added by small businesses: food and beverage service | ₹1,34,693 crore |
Source and notes
Source: Advanton estimate from MoSPI HCES 2023-24 (household spending), population projections for 2025 and MoSPI ASUSE 2023-24 (unincorporated enterprises). Period: 2023-24 survey data, 2025 population. Coverage: India.
Demand side: monthly spending per person on each category (HCES 2023-24, urban and rural) × projected 2025 urban and rural population × 12. Supply side: number of unincorporated businesses in the activity × average gross value added per business (ASUSE 2023-24, urban and rural). Figures in current prices; the survey years differ from the population year, so treat the result as an order of magnitude.
Cite this statistic
Formats, embedding and reuse: how to cite Advanton.
Please also credit the original source: Advanton estimate from MoSPI HCES 2023-24 (household spending), population projections for 2025 and MoSPI ASUSE 2023-24 (unincorporated enterprises).Related statistics
- What people in urban India spend on each month, by category, 2023-24
- Food and beverage service (restaurants, dhabas, caterers, cafes, stalls) in India: number of small businesses and earnings, 2023-24
- Size of India's household spending markets by category (estimate)
- Assisted Living and Group Homes market size in India (estimate)
- Clothing and Gift Boutiques market size in India (estimate)
- Butcher Shops market size in India (estimate)
- Cabinet and Countertop Businesses market size in India (estimate)
- Content Creation and Writing Businesses market size in India (estimate)
Need more detail? Build a free India market report for any business and state.
Last reviewed November 9, 2026. Startup costs are estimates; check local prices, licensing and tax rules before you commit money.