
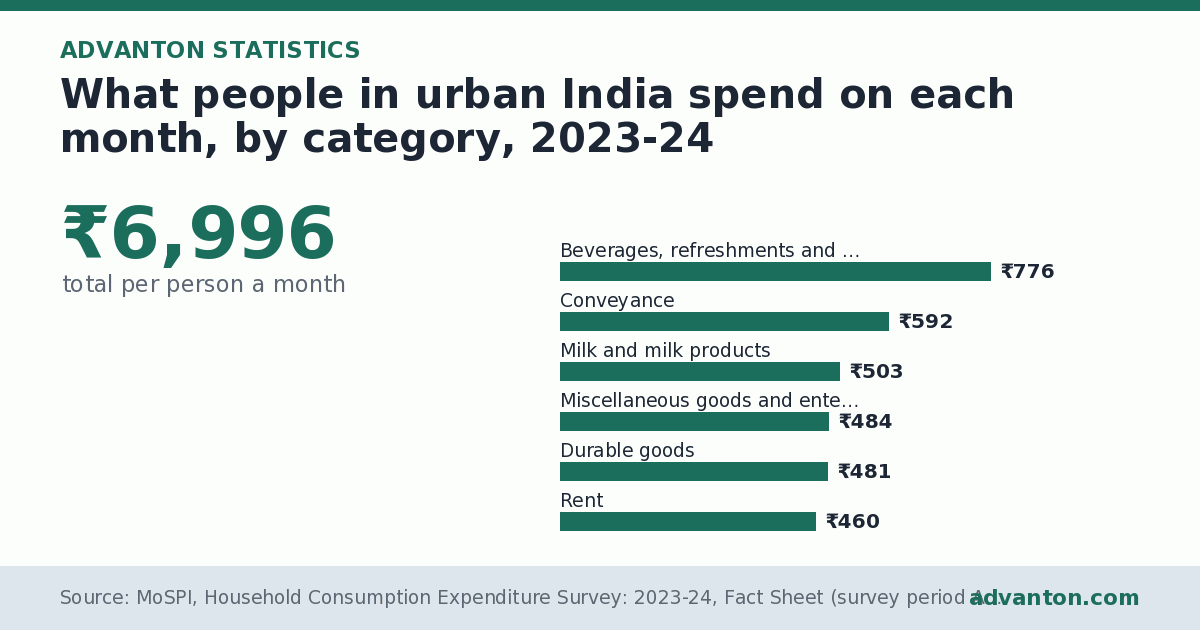
What people in urban India spend on each month, by category: ₹6,996 (total per person a month). Of ₹6,996 spent per person a month in urban India, the biggest category is beverages, refreshments and processed food (₹776), followed by conveyance (₹592).
Data last updated · Period: 2023-24
Understanding the chart
The bar chart above shows what people in urban India spend on each month, by category, with one bar for each of the 21 figures, sorted from highest to lowest. Each bar is labelled with its exact value, and values are per person a month, in ₹. The longest bar is the highest. The first bar is Beverages, refreshments and processed food at ₹776 and the last Taxes and cesses at ₹23. The data table below the chart lists every value, and you can download the data, embed the chart or share it from the buttons above. The figures cover 2023-24 and come from MoSPI, Household Consumption Expenditure Survey: 2023-24, Fact Sheet (survey period August 2023 to July 2024; MPCE without imputing free items).
Key insights
- The top three are Beverages, refreshments and processed food (₹776), Conveyance (₹592), Milk and milk products (₹503).
- The lowest are Taxes and cesses (₹23), Sugar and salt (₹40), Pulses and their products (₹98).
- Across all 21 groups, the median is ₹391, and the top value is 2.0 times the median.
Analysis
The middle half of the 21 values lies between ₹166 and ₹460, so a typical value is around ₹391 (the median); the average is ₹333. 11 of the 21 are above the average and 10 below it. The highest value, ₹776 for Beverages, refreshments and processed food, is 33.7 times the lowest, ₹23 for Taxes and cesses.
What it means
Category spending shows where household budgets go. Food takes a large share in rural India, while urban households spend more on transport, rent, education, services and meals bought outside the home. Businesses can use these shares to judge which categories have the most spending to compete for.
Related figures
- What people in rural India spend on each month, by category, 2023-24: ₹4,122 (total per person a month). Of ₹4,122 spent per person a month in rural India, the biggest category is beverages, refreshments and processed food (₹406), followed by milk and milk products (₹348).
- Monthly spending per person by spending level, urban India, 2023-24: ₹20,310 (top 5% of urban India). The top 5% of urban India spend ₹20,310 per person a month, about 8.5 times the bottom 5% (₹2,376).
- Monthly spending per person by type of household, India, 2023-24: ₹7,606 (urban salaried households). Households with regular wage or salaried earners spend more per person than self-employed and casual labour households, in towns and villages.
About this statistic
Monthly per capita consumption expenditure (MPCE) is the average amount a person's household spends in a month, divided by the number of people in it. It comes from MoSPI's Household Consumption Expenditure Survey 2023-24, which recorded the spending of more than 2.6 lakh households on food, fuel, rent, transport, education, health, services and durable goods between August 2023 and July 2024.
Spending is not the same as income, but it is a reliable guide to living standards and to what local markets can support. Businesses use it to judge how much customers in a state can afford, how urban and rural markets differ, and which categories take the biggest share of household budgets.
Questions and answers
Which groups rank highest for what people in urban India spend on each month,?
₹6,996 (total per person a month). Of ₹6,996 spent per person a month in urban India, the biggest category is beverages, refreshments and processed food (₹776), followed by conveyance (₹592).
Which rank lowest, and what is typical?
The top three are Beverages, refreshments and processed food (₹776), Conveyance (₹592), Milk and milk products (₹503). The lowest are Taxes and cesses (₹23), Sugar and salt (₹40), Pulses and their products (₹98).
Where does this data come from?
From MoSPI, Household Consumption Expenditure Survey: 2023-24, Fact Sheet (survey period August 2023 to July 2024; MPCE without imputing free items), covering 2023-24. The 21 item groups sum to the total MPCE.
How this page was made
Generated by Advanton from MoSPI, Household Consumption Expenditure Survey: 2023-24 (2023-24), data updated 9 November 2026: chart, ranks, comparisons and text are computed from the published figures; no figures are changed. About the data.
Data
| Category | Per person a month (₹) |
|---|---|
| Beverages, refreshments and processed food | ₹776 |
| Conveyance | ₹592 |
| Milk and milk products | ₹503 |
| Miscellaneous goods and entertainment | ₹484 |
| Durable goods | ₹481 |
| Rent | ₹460 |
| Education | ₹418 |
| Medical | ₹409 |
| Consumer services | ₹400 |
| Clothing, bedding and footwear | ₹396 |
| Fuel and light | ₹391 |
| Vegetables | ₹288 |
| Fruits | ₹271 |
| Cereals and cereal substitutes | ₹263 |
| Egg, fish and meat | ₹249 |
| Pan, tobacco and intoxicants | ₹166 |
| Spices | ₹161 |
| Edible oil | ₹127 |
| Pulses and their products | ₹98 |
| Sugar and salt | ₹40 |
| Taxes and cesses | ₹23 |
Source and notes
Source: MoSPI, Household Consumption Expenditure Survey: 2023-24, Fact Sheet (survey period August 2023 to July 2024; MPCE without imputing free items). Period: 2023-24. Coverage: India.
The 21 item groups sum to the total MPCE.
Cite this statistic
Please also credit the original source: MoSPI, Household Consumption Expenditure Survey: 2023-24, Fact Sheet (survey period August 2023 to July 2024; MPCE without imputing free items).Related statistics
- What people in rural India spend on each month, by category, 2023-24
- Monthly spending per person by spending level, urban India, 2023-24
- Monthly spending per person by type of household, India, 2023-24
- Average monthly spending per person in Arunachal Pradesh, 2023-24
- Average monthly spending per person in Delhi, 2023-24
- Average monthly spending per person in Jharkhand, 2023-24
- Average monthly spending per person in Manipur, 2023-24
- Average monthly spending per person in West Bengal, 2023-24
Need more detail? Build a free India market report for any business and state.
Last reviewed November 9, 2026. Startup costs are estimates; check local prices, licensing and tax rules before you commit money.

