
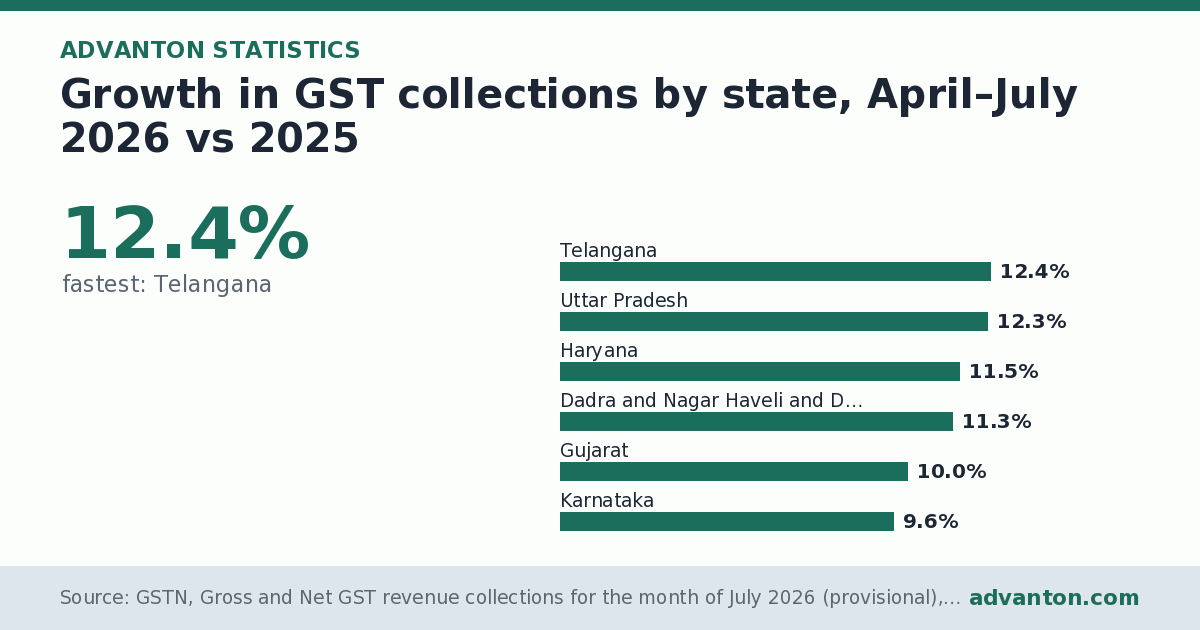
Growth in GST collections by state: 12.4% (fastest: Telangana). Domestic GST collections grew fastest in Telangana (12.4%) in April to July 2026 compared with a year earlier, and fell most in Sikkim (-52.1%). Across all states, domestic GST grew 4.5%.
Data last updated · Period: April–July 2026
Understanding the chart
The bar chart above shows growth in GST collections by state, April–July 2026 vs 2025, with one bar for each of the 36 figures, sorted from highest to lowest. Each bar is labelled with its exact value, and values are change in domestic GST, in %. The longest bar is the highest. The first bar is Telangana at 12.4% and the last Sikkim at -52.1%. 17 values are below zero, drawn in red. The data table below the chart lists every value, and you can download the data, embed the chart or share it from the buttons above. The figures cover April–July 2026 and come from GSTN, Gross and Net GST revenue collections for the month of July 2026 (provisional), tables 3 and 4 and the summary table.
Key insights
- The top three are Telangana (12.4%), Uttar Pradesh (12.3%), Haryana (11.5%).
- The lowest are Sikkim (-52.1%), Himachal Pradesh (-23.1%), Lakshadweep (-22.5%).
- Across all 36 states and union territories, the median is 0.2%.
Analysis
The middle half of the 36 values lies between -6.0% and 7.4%, so a typical value is around 0.2% (the median); the average is -2.0%, pulled down by a few very low values. 21 of the 36 are above the average and 15 below it.
What it means
GST collections are one of the fastest official signals of business activity: they rise when firms sell more and fall when trade slows. For a business, a state with fast-growing collections and many registrations is an active market with many potential customers and suppliers, but also more competition. A low number of registrations per person can point to a large informal economy, where many small traders sell below the GST threshold of ₹40 lakh for goods (₹20 lakh for services, lower in some states). Compare collections with population and household spending to judge how much of a state's activity is local demand and how much is business located there.
Related figures
- GST collections by state in India, April–July 2026: ₹5,95,978 crore (domestic GST from all states, April–July 2026). Taxpayers registered in Indian states paid ₹5,95,978 crore of domestic GST in April to July 2026.
About this statistic
The Goods and Services Tax (GST) is India's main tax on the supply of goods and services. Each sale within a state carries central GST (CGST) and state GST (SGST) in equal halves, while sales between states and imports carry integrated GST (IGST), which is later shared between the Centre and the destination state. These figures come from the monthly revenue report of the GST Network (GSTN), which runs the GST system, and are provisional.
State figures here are domestic GST paid by taxpayers registered in each state, before refunds and before IGST is settled between the Centre and states, and exclude GST on imports. Because GST is paid where a business is registered rather than where its customers live, states with many company headquarters, factories and warehouses collect more than their share of consumption. A GSTIN is a GST registration; one business can hold registrations in several states.
Questions and answers
Which states rank highest for growth in GST collections?
12.4% (fastest: Telangana). Domestic GST collections grew fastest in Telangana (12.4%) in April to July 2026 compared with a year earlier, and fell most in Sikkim (-52.1%). Across all states, domestic GST grew 4.5%.
Which rank lowest, and what is typical?
The top three are Telangana (12.4%), Uttar Pradesh (12.3%), Haryana (11.5%). The lowest are Sikkim (-52.1%), Himachal Pradesh (-23.1%), Lakshadweep (-22.5%).
Where does this data come from?
From GSTN, Gross and Net GST revenue collections for the month of July 2026 (provisional), tables 3 and 4 and the summary table, covering April–July 2026. Figures are provisional. State figures are domestic GST collected from taxpayers registered in each state (CGST, SGST and IGST), excluding GST on imports; April to July 2026 is the first four months of financial year 2026-27. Registrations (GSTINs) are as on 31 July 2026, counting both central and state jurisdictions.
How this page was made
Generated by Advanton from GSTN, Gross and Net GST revenue collections for the month of July 2026 (April–July 2026), data updated 10 November 2026: chart, ranks, comparisons and text are computed from the published figures; no figures are changed. Our methodology.
Data
| State or union territory | Change in domestic GST (%) |
|---|---|
| Telangana | 12.4% |
| Uttar Pradesh | 12.3% |
| Haryana | 11.5% |
| Dadra and Nagar Haveli and Daman and Diu | 11.3% |
| Gujarat | 10.0% |
| Karnataka | 9.6% |
| Kerala | 9.6% |
| Nagaland | 8.2% |
| Punjab | 7.5% |
| Maharashtra | 7.4% |
| Tripura | 7.3% |
| Arunachal Pradesh | 6.1% |
| Andaman and Nicobar Islands | 4.0% |
| Chandigarh | 2.2% |
| Ladakh | 1.6% |
| Chhattisgarh | 0.6% |
| Odisha | 0.3% |
| Goa | 0.3% |
| Andhra Pradesh | 0.0% |
| Delhi | -0.5% |
| Mizoram | -1.3% |
| Assam | -2.5% |
| Madhya Pradesh | -2.8% |
| West Bengal | -3.2% |
| Tamil Nadu | -3.3% |
| Jharkhand | -3.6% |
| Bihar | -3.7% |
| Jammu and Kashmir | -6.0% |
| Rajasthan | -6.3% |
| Manipur | -11.5% |
| Meghalaya | -13.4% |
| Puducherry | -19.8% |
| Uttarakhand | -20.0% |
| Lakshadweep | -22.5% |
| Himachal Pradesh | -23.1% |
| Sikkim | -52.1% |
Source and notes
Source: GSTN, Gross and Net GST revenue collections for the month of July 2026 (provisional), tables 3 and 4 and the summary table. Period: April–July 2026. Coverage: India.
Figures are provisional. State figures are domestic GST collected from taxpayers registered in each state (CGST, SGST and IGST), excluding GST on imports; April to July 2026 is the first four months of financial year 2026-27. Registrations (GSTINs) are as on 31 July 2026, counting both central and state jurisdictions.
Cite this statistic
Formats, embedding and reuse: how to cite Advanton.
Please also credit the original source: GSTN, Gross and Net GST revenue collections for the month of July 2026 (provisional), tables 3 and 4 and the summary table.Related statistics
- GST collections by state in India, April–July 2026
- GST collections in Uttar Pradesh, 2026-27
- GST collections in Manipur, 2026-27
- GST collections in Chhattisgarh, 2026-27
- GST collections in Karnataka, 2026-27
- GST collections in Andhra Pradesh, 2026-27
Need more detail? Build a free India market report for any business and state.
Last reviewed November 9, 2026. Startup costs are estimates; check local prices, licensing and tax rules before you commit money.

