
Key figures
- Existing-home sales: 3.75 million a year (seasonally adjusted annual rate) in October 2026, down 8.8% from a year earlier and the lowest since August 2010 (NAR).
- Median existing-home price: $416,700, up just 0.4% in a year.
- 30-year mortgage rate: 7.11% (12 November 2026), against 6.24% a year earlier (Freddie Mac).
- On a median-priced home with 20% down, the monthly payment is $2,243, about $193 more than at last year’s rate: $2,316 a year.
US home sales have slowed to their lowest level in 16 years. In October 2026, existing homes sold at an annual rate of 3.75 million, according to the National Association of Realtors (NAR), as the 30-year mortgage rate rose to 7.11% from 6.24% a year earlier while prices barely moved.
Data: NAR existing-home sales for October 2026 (released 12 November 2026); Freddie Mac Primary Mortgage Market Survey (12 November 2026); monthly payments calculated by Advanton. Updated monthly.
The market in October 2026
Table of Contents
| Measure | October 2025 | September 2026 | October 2026 |
|---|---|---|---|
| Sales (annual rate) | about 4.11 million* | 3.75 million | |
| Median price | $414,900 | $416,700 | |
| First-time buyers’ share of sales | 32% | 31% | 29% |
| Months of supply | 4.4 | 4.7 | 5.1 |
| Homes for sale | 1.59 million | ||
| 30-year fixed mortgage rate | 6.24% (Nov 2025) | 7.11% (12 Nov 2026) | |
| 15-year fixed mortgage rate | 5.49% (Nov 2025) | 6.45% |
Implied by NAR’s 8.8% year-on-year fall.
Fewer first-time buyers, more homes waiting longer for buyers (5.1 months of supply, up from 4.4), and almost no price growth: a market where rates, not prices, are doing the work.
Monthly payment at different rates
Monthly mortgage payment on a median-priced US home
Principal and interest on a $416,700 home with 20% down, 30-year fixed, at different interest rates
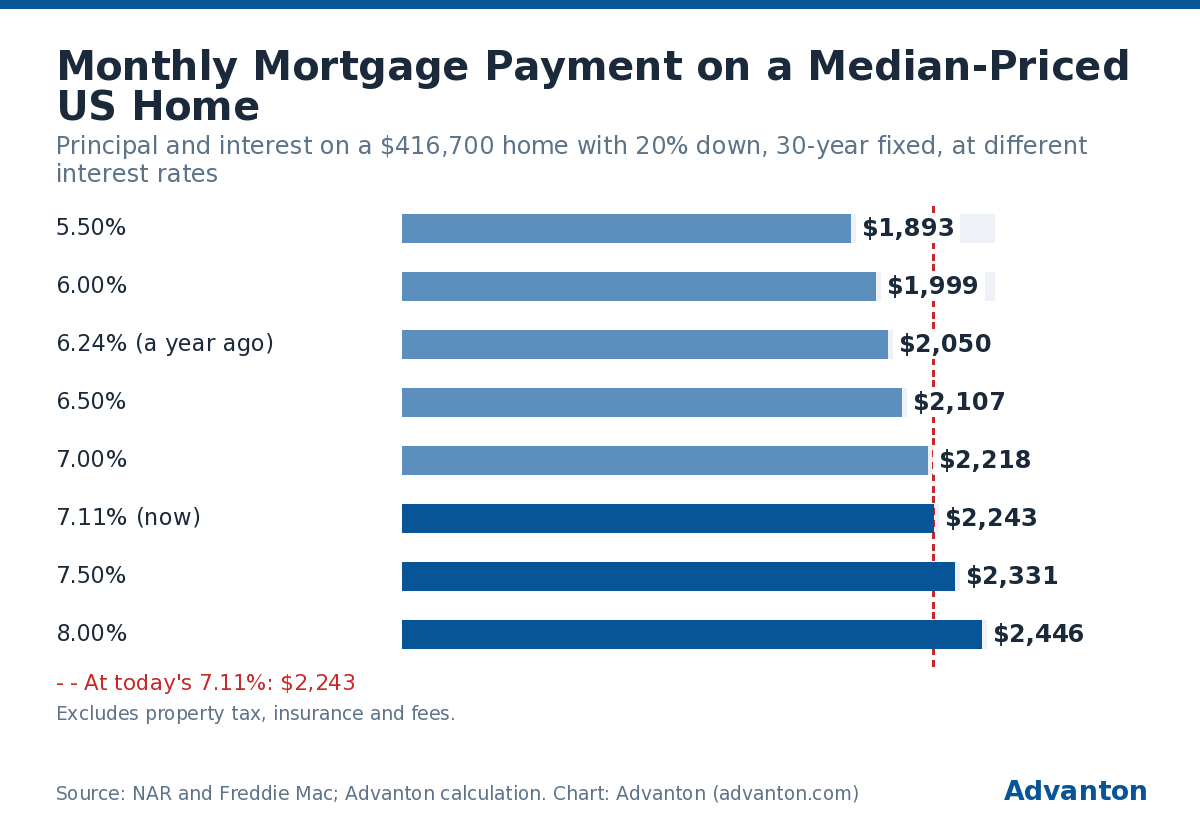
At today's 7.11%: $2,243
Excludes property tax, insurance and fees.
| Mortgage rate | Monthly payment, 20% down | Monthly payment, 10% down |
|---|---|---|
| 5.50% | $1,893 | $2,129 |
| 6.00% | $1,999 | $2,248 |
| 6.24% (a year ago) | $2,050 | $2,307 |
| 6.50% | $2,107 | $2,370 |
| 7.00% | $2,218 | $2,495 |
| 7.11% (now) | $2,243 | $2,523 |
| 7.50% | $2,331 | $2,622 |
| 8.00% | $2,446 | $2,752 |
Principal and interest only, 30-year fixed loan on a $416,700 home (loan of $333,360 with 20% down, $375,030 with 10% down). Property taxes, insurance, mortgage insurance and fees are extra.
What the rate rise costs a buyer
At today’s 7.11% instead of last year’s 6.24%, a buyer of a median-priced home with 20% down pays:
- $193 more a month ($2,243 vs $2,050);
- about $2,300 more a year;
- about $69,000 more over 30 years, if the loan runs its full term without refinancing.
Understanding the numbers
"3.75 million a year" explained
NAR reports sales as a seasonally adjusted annual rate: the number of homes that would sell in a year if every month were like October, after allowing for normal seasonal patterns. It counts sales of existing homes (houses, townhouses, condos and co-ops), not newly built ones.
Median price, not average
Half of the homes sold for more than $416,700 and half for less. The median moves with the mix of homes sold, not only with prices, so a 0.4% change is best read as "prices broadly flat".
Months of supply
At the current pace of sales, the 1.59 million homes for sale would take 5.1 months to sell, up from 4.4 a year earlier. More months of supply means more choice for buyers and less pressure on prices; around six months is often described as a balanced market.
First-time buyers are being squeezed out
First-time buyers made up 29% of sales in October, down from 32% a year earlier. They usually have the smallest down payments and no home equity to bring, so higher monthly payments hit them hardest.
Why rates matter more than prices right now
Prices barely moved in a year (+0.4%), but the 30-year mortgage rate rose from 6.24% to 7.11%. On a median-priced home with 20% down, that adds $193 a month. A 4% rise in the price at last year’s rate would have added only about $82. The rate change has the same effect on the payment as a price rise of roughly 9%. For most buyers, the monthly payment, not the price tag, decides what they can afford.
A rule of thumb from the table: on this loan, every quarter-point (0.25%) on the rate adds roughly $55 a month to the payment.
With a smaller down payment
With 10% down, the loan is larger ($375,030), the payment at 7.11% is $2,523, and most lenders also require private mortgage insurance until the loan falls to 80% of the home’s value, so the real monthly cost is higher still.
What this means
- Buyers: compare offers on the annual percentage rate (APR) and points, not just the rate. Even a small rate difference is worth thousands over the loan.
- Sellers: with 5.1 months of supply, homes take longer to sell; pricing correctly from the start matters more.
- Businesses tied to housing (movers, remodellers, furniture, mortgage brokers, inspectors): fewer sales mean fewer moves and fewer jobs; see our guides for home services and small business finance.
Frequently asked questions
How many homes sold in the US in October 2026?
Existing-home sales ran at a seasonally adjusted annual rate of 3.75 million, down 5.5% from September and 8.8% from a year earlier, NAR reported on 12 November 2026.
What is the median home price in the US?
$416,700 for existing homes in October 2026, up 0.4% from $414,900 a year earlier.
What is the current 30-year mortgage rate?
7.11% on average in Freddie Mac’s survey for the week of 12 November 2026, against 6.24% a year earlier.
How much is the monthly payment on a median-priced home?
About $2,243 in principal and interest with 20% down at 7.11%, before taxes and insurance; $2,523 with 10% down.
About the data
- Sales and prices: National Association of Realtors, existing-home sales, October 2026 (12 November 2026). Sales are seasonally adjusted annual rates; the median price is not seasonally adjusted.
- Mortgage rates: Freddie Mac Primary Mortgage Market Survey, weekly average for 12 November 2026, and the same week a year earlier.
- Payments: standard 30-year fixed amortisation formula, calculated by Advanton.
Use this chart
Cite or embed the payment chart free with the buttons above it. Please keep the credit link.
Last reviewed November 17, 2026. Startup costs are estimates; check local prices, licensing and tax rules before you commit money.
Advanton presents official data as easy-to-read charts and figures. The figures on this page come from the sources named with each statistic and chart, and those sources may revise them. This page is general information, not financial or investment advice. See our disclaimer.