
US sales at food services and drinking places: $807.3 billion (sales, January–September 2026). Food services and drinking places (restaurants and bars) sold $807.3 billion in January to September 2026, up 4.4% from the same months of 2025. In September 2026 alone, seasonally adjusted sales were $92.9 billion, 7% higher than a year earlier.
Data last updated · Period: January–September 2026
Understanding the chart
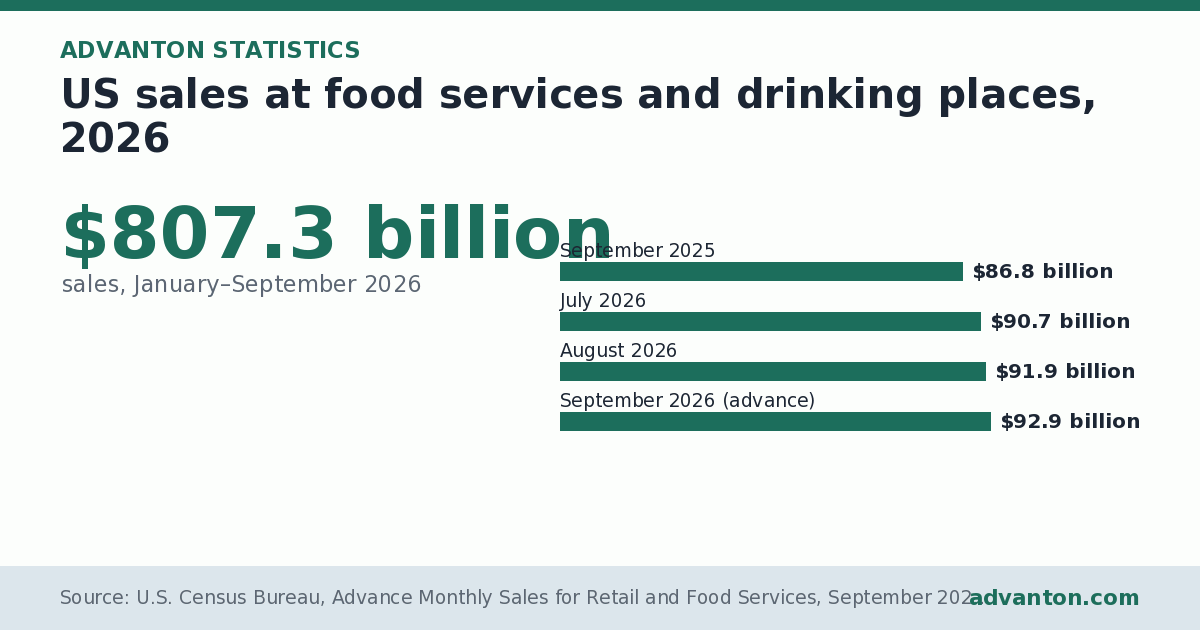
The bar chart above shows US sales at food services and drinking places, with one bar for each of the 4 figures. Each bar is labelled with its exact value, and values are monthly sales, seasonally adjusted, in $. The longest bar is the highest. The bars are, in order: September 2025 at $86.8 billion; July 2026 at $90.7 billion; August 2026 at $91.9 billion; September 2026 (advance) at $92.9 billion. The data table below the chart lists every value, and you can download the data, embed the chart or share it from the buttons above. The figures cover January–September 2026 and come from U.S. Census Bureau, Advance Monthly Sales for Retail and Food Services, September 2026 (release CB26-165, 15 October 2026), tables 1 and 2.
Key insights
- That is 12.5% of all US retail and food services sales in the period.
- Sales grew 4.4% against 4.7% for all retail and food services, so this market lost share.
- Among the 13 types of business Census reports, it ranks 3rd by sales and 8th by growth.
- At this pace, full-year 2026 sales would be roughly $1,076 billion (an estimate: nine months scaled to twelve, ignoring the holiday season, so the real figure is likely higher).
- Month to month, September 2026 sales were 7% higher than a year earlier, faster than the 4.4% rise for the first nine months as a whole.
Analysis
September 2025 ($86.8 billion) is 4% lower than July 2026 ($90.7 billion), a difference of $3.8 billion. September 2025 ($86.8 billion) is 5% lower than August 2026 ($91.9 billion), a difference of $5.0 billion. September 2025 ($86.8 billion) is 7% lower than September 2026 (advance) ($92.9 billion), a difference of $6.1 billion. Across the 4 bars, the highest is September 2026 (advance) and the lowest is September 2025.
What it means
This group covers full-service and limited-service restaurants, cafés, caterers, food trucks and bars. For anyone starting or growing a store, national sales show the size of the market and whether it is growing faster or slower than retail overall. Growing markets give new entrants room; flat or shrinking ones mean winning customers from established competitors. Because the figures are not adjusted for inflation, compare growth with price changes before concluding that more goods are being sold.
Related figures
- US retail and food services sales by type of business, January–September 2026: $6.45 trillion (total retail and food services sales, January–September 2026). US retail and food services businesses sold $6.45 trillion of goods and services in the first nine months of 2026, 4.7% more than a year earlier.
- Growth in US retail sales by type of business, 2026 vs 2025: 17.0% (fastest: gasoline stations). Gasoline stations grew fastest, with sales up 17% in January to September 2026 from a year earlier; health and personal care stores fell most (-1.9%).
- E-commerce share of US retail sales, 2000–2026: 17.1% (of US retail sales were online, 2026 Q2). Online sales made up 17.1% of US retail sales in 2026 Q2, up from 16.3% a year earlier and less than 1% in 2000.
About this statistic
These figures come from the Census Bureau's Advance Monthly Retail Trade Survey and Monthly Retail Trade Survey, which ask a sample of about 4,800 firms (advance) and 10,800 firms (monthly) for their sales each month, weighted to represent more than three million retail and food services businesses. Businesses are grouped by their main activity under the North American Industry Classification System (NAICS), so a supermarket that sells clothes still counts as a grocery store.
Monthly figures are seasonally adjusted to remove holiday and trading-day effects; nine-month totals are not. Sales are in current dollars, not adjusted for inflation, and September 2026 figures are early (advance) estimates that Census will revise. Since April 2025 the estimates cover only businesses with paid employees.
Questions and answers
What is the uS sales at food services and drinking places?
$807.3 billion (sales, January–September 2026). Food services and drinking places (restaurants and bars) sold $807.3 billion in January to September 2026, up 4.4% from the same months of 2025. In September 2026 alone, seasonally adjusted sales were $92.9 billion, 7% higher than a year earlier.
How does United States compare?
That is 12.5% of all US retail and food services sales in the period. Sales grew 4.4% against 4.7% for all retail and food services, so this market lost share.
Where does this data come from?
From U.S. Census Bureau, Advance Monthly Sales for Retail and Food Services, September 2026 (release CB26-165, 15 October 2026), tables 1 and 2, covering January–September 2026. NAICS 722. Estimates cover businesses with paid employees only (nonemployers were removed from the series with the April 2025 benchmark). January to September totals are not seasonally adjusted; monthly figures are seasonally adjusted. Figures are not adjusted for price changes. September 2026 figures are advance estimates and will be revised.
How this page was made
Generated by Advanton from U.S. Census Bureau, Advance Monthly Sales for Retail and Food Services, September 2026 (January–September 2026), data updated 10 November 2026: chart, ranks, comparisons and text are computed from the published figures; no figures are changed. Our methodology.
Data
| Month | Monthly sales, seasonally adjusted ($) |
|---|---|
| September 2025 | $86.8 billion |
| July 2026 | $90.7 billion |
| August 2026 | $91.9 billion |
| September 2026 (advance) | $92.9 billion |
Source and notes
Source: U.S. Census Bureau, Advance Monthly Sales for Retail and Food Services, September 2026 (release CB26-165, 15 October 2026), tables 1 and 2. Period: January–September 2026. Coverage: United States.
NAICS 722. Estimates cover businesses with paid employees only (nonemployers were removed from the series with the April 2025 benchmark). January to September totals are not seasonally adjusted; monthly figures are seasonally adjusted. Figures are not adjusted for price changes. September 2026 figures are advance estimates and will be revised.
Cite this statistic
Formats, embedding and reuse: how to cite Advanton.
Please also credit the original source: U.S. Census Bureau, Advance Monthly Sales for Retail and Food Services, September 2026 (release CB26-165, 15 October 2026), tables 1 and 2.Related statistics
- US retail and food services sales by type of business, January–September 2026
- Growth in US retail sales by type of business, 2026 vs 2025
- E-commerce share of US retail sales, 2000–2026
- US retail and food services sales, 2026
- US sales at food and beverage stores, 2026
- US sales at department stores, 2026
Need more detail? Build a free India market report for any business and state.
Last reviewed November 9, 2026. Startup costs are estimates; check local prices, licensing and tax rules before you commit money.