
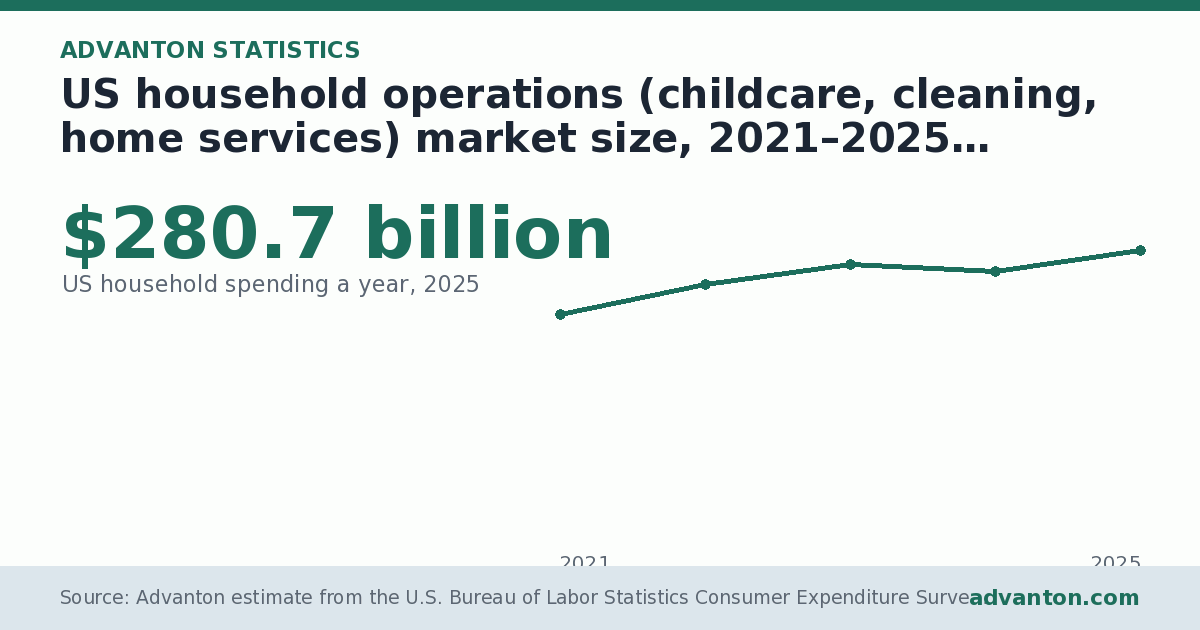
US household operations market size: $280.7 billion (US household spending a year, 2025). US households spent an estimated $280.7 billion on household operations (childcare, cleaning, home services) in 2025: average spending of $2,034 per household times about 138 million households.
Understanding the chart
The line chart above tracks US household operations (childcare, cleaning, home services) market size for each year from 2021 to 2025, 5 data points in all. Each dot is one year; the first and last years and the highest point are labelled with their values, and the vertical scale is in $ a year, estimate. All values in this period were above zero. The data table below the chart lists every value, and you can download the data, embed the chart or share it from the buttons above. The figures cover 2021–2025 and come from Advanton estimate from the U.S. Bureau of Labor Statistics Consumer Expenditure Survey (average spending per consumer unit × number of consumer units).
Key insights
- From 2021 to 2025 the figure moved from $218.8 billion to $280.7 billion, a change of 28.3%.
- The highest value was $280.7 billion (2025) and the lowest $218.8 billion (2021).
- The biggest single change came between 2021 and 2022 (+$29.1 billion).
- The latest readings have moved up and down.
Analysis
The value went up in 3 of the 4 year-to-year steps and down in 1. The biggest one-year rise came in 2022 (+$29.1 billion, or 13.3%). The biggest one-year fall came in 2024 (−$6.3 billion, or 2.4%). Across the period the values varied by about 9% around their average ($255.1 billion), a fairly steady path.
What it means
A market size estimate answers the first question in any business plan: is there enough spending to support another business? Use it as a ceiling, then narrow down. Take your town or district's share of the state market (roughly its share of the state's population, adjusted for whether it is urban or rural), think about how many competitors already share that spending, and estimate the realistic share you could win in your first years. Lenders and investors look for exactly this reasoning, and the method and sources on this page can be cited in a business plan or loan application.
Related figures
- US household spending on household operations (childcare, cleaning, home services), 2021–2025: $2,034 (per household a year, 2025). US households spent an average of $2,034 a year on household operations (childcare, cleaning, home services) in 2025, up 5.9% from $1,921 in 2024, 2.5% of all household spending.
- Where US household money goes: spending by category, 2025: $27,790 (largest: housing, per household a year). The largest item is housing at $27,790 a household a year (33.9% of this group), followed by transportation ($13,492).
About this statistic
This estimate multiplies the average amount US households spend on the category each year, from the Bureau of Labor Statistics' Consumer Expenditure Survey, by the number of households (consumer units) in the survey: about 138 million in 2025. It measures spending by households only, not by businesses or government, and survey-based spending is known to run below the national accounts (BEA) for many categories, so treat it as a conservative estimate.
Market size estimates help you judge the scale of a market before you go deeper: compare it with the number of competitors, the share you could realistically win, and local spending in your area.
Questions and answers
What is the uS household operations (childcare, cleaning, home services) market size?
$280.7 billion (US household spending a year, 2025). US households spent an estimated $280.7 billion on household operations (childcare, cleaning, home services) in 2025: average spending of $2,034 per household times about 138 million households.
How has it changed over time?
From 2021 to 2025 the figure moved from $218.8 billion to $280.7 billion, a change of 28.3%. The highest value was $280.7 billion (2025) and the lowest $218.8 billion (2021).
Where does this data come from?
From Advanton estimate from the U.S. Bureau of Labor Statistics Consumer Expenditure Survey (average spending per consumer unit × number of consumer units), covering 2021–2025. Average annual spending per consumer unit × number of consumer units, each year. Consumer Expenditure Survey totals are known to be lower than national accounts (BEA) for many categories, so these are conservative estimates of household spending only, excluding business and government purchases. Because of the 2025 lapse in federal appropriations, the Census Bureau could not collect the survey in October and November 2025; BLS adjusted the survey weights to account for the missing months.
How this page was made
Generated by Advanton from Advanton estimate from the U.S. Bureau of Labor Statistics Consumer Expenditure Survey (2021–2025): chart, ranks, comparisons and text are computed from the published figures; estimates are Advanton's, with the method shown. Our methodology.
Data
| Year | Household spending ($ a year, estimate) |
|---|---|
| 2021 | $218.8 billion |
| 2022 | $247.9 billion |
| 2023 | $267.1 billion |
| 2024 | $260.8 billion |
| 2025 | $280.7 billion |
Source and notes
Source: Advanton estimate from the U.S. Bureau of Labor Statistics Consumer Expenditure Survey (average spending per consumer unit × number of consumer units). Period: 2021–2025. Coverage: United States.
Average annual spending per consumer unit × number of consumer units, each year. Consumer Expenditure Survey totals are known to be lower than national accounts (BEA) for many categories, so these are conservative estimates of household spending only, excluding business and government purchases. Because of the 2025 lapse in federal appropriations, the Census Bureau could not collect the survey in October and November 2025; BLS adjusted the survey weights to account for the missing months.
Cite this statistic
Formats, embedding and reuse: how to cite Advanton.
Please also credit the original source: Advanton estimate from the U.S. Bureau of Labor Statistics Consumer Expenditure Survey (average spending per consumer unit × number of consumer units).Related statistics
- US household spending on household operations (childcare, cleaning, home services), 2021–2025
- Where US household money goes: spending by category, 2025
- Bed and Breakfasts and Inns market size in India (estimate)
- Chocolate Makers and Chocolatiers market size in India (estimate)
- Commissary and Shared Kitchens market size in India (estimate)
- Ghost Kitchens and Delivery-Only Restaurants market size in India (estimate)
- Graphic Design Businesses market size in India (estimate)
- Machine Shops market size in India (estimate)
Need more detail? Build a free India market report for any business and state.
Last reviewed November 9, 2026. Startup costs are estimates; check local prices, licensing and tax rules before you commit money.