
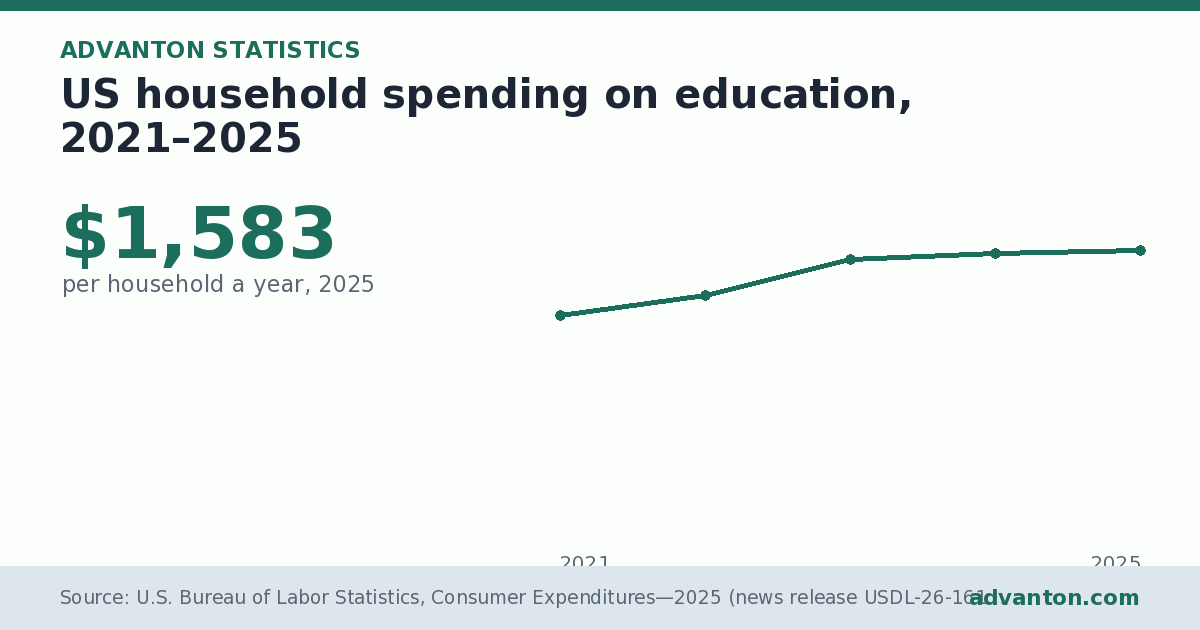
US household spending on education: $1,583 (per household a year, 2025). US households spent an average of $1,583 a year on education in 2025, up 0.9% from $1,569 in 2024, 1.9% of all household spending.
Data last updated · Period: 2021–2025
Understanding the chart
The line chart above tracks US household spending on education for each year from 2021 to 2025, 5 data points in all. Each dot is one year; the first and last years and the highest point are labelled with their values, and the vertical scale is in $ a year. All values in this period were above zero. The data table below the chart lists every value, and you can download the data, embed the chart or share it from the buttons above. The figures cover 2021–2025 and come from U.S. Bureau of Labor Statistics, Consumer Expenditures—2025 (news release USDL-26-1619, 29 October 2026), tables 1 to 3; U.S. Bureau of Labor Statistics, Consumer expenditures in 2024 (BLS Report 1119, August 2026), tables 1 and 2.
Key insights
- Spending changed by +$14 (0.9%) between 2024 and 2025, against consumer price inflation of 2.6%, so in real terms it fell.
- Since 2021, spending has risen 29.1% (about 6.6% a year), while prices rose about 18.7%, a real rise of about 8.8%.
- It took 1.9% of the average household budget in 2025, or about 1.9 cents of every dollar spent.
- Among the 14 major spending categories, it ranks 9th by average spending.
- Multiplied across about 138 million US households, that is roughly $218.4 billion a year spent on this category (an estimate: average spending times the number of households).
- BLS did not find the 2024 to 2025 change statistically significant, so it may reflect survey sampling rather than a real shift.
Analysis
The value went up in 4 of the 4 year-to-year steps and down in 0. The biggest one-year rise came in 2023 (+$200, or 15.0%). Across the period the values varied by about 11% around their average ($1,450), a moderate amount of change.
What it means
This category covers tuition and fees for college, school and other courses, plus books and supplies; schools, tutors and training providers serve it. For businesses, average household spending sets the size of the prize: multiplied by the number of households in a town or region, it gives a first estimate of the local market. Spending that is growing faster than prices points to rising demand, while spending that lags inflation means customers are buying less in real terms and competing businesses fight harder for each dollar. Higher-income households spend far more in absolute terms, so who your customers are matters as much as the national average.
Related figures
- Where US household money goes: spending by category, 2025: $27,790 (largest: housing, per household a year). The largest item is housing at $27,790 a household a year (33.9% of this group), followed by transportation ($13,492).
- US household spending and income by income level, 2025: $159,512 (spending a year, highest-income fifth). The highest-income fifth of US households spent $159,512 in 2025, 4.2 times the lowest fifth ($37,935).
- Average annual spending of US households, 2021–2025: $81,905 (per household a year, 2025). US households spent an average of $81,905 a year on goods and services in 2025, up 4.3% from $78,527 in 2024.
About this statistic
These figures come from the U.S. Bureau of Labor Statistics' Consumer Expenditure Survey (CE), the main official source on what American households buy. It combines two surveys run by the Census Bureau for BLS: a quarterly interview survey of large and regular purchases and a two-week diary of small, frequent purchases. Results are averages per consumer unit, which is close to a household: about 138 million in 2025, with 2.4 people on average.
Spending is out of pocket, so it excludes things paid for by employers or government, such as employer health premiums. Because of the 2025 lapse in federal appropriations, the survey could not be collected in October and November 2025, and BLS adjusted the survey weights to cover the gap. Year-to-year changes in small categories can reflect sampling, which is why BLS tests them for statistical significance.
Questions and answers
What is the uS household spending on education?
$1,583 (per household a year, 2025). US households spent an average of $1,583 a year on education in 2025, up 0.9% from $1,569 in 2024, 1.9% of all household spending.
How has it changed over time?
Spending changed by +$14 (0.9%) between 2024 and 2025, against consumer price inflation of 2.6%, so in real terms it fell. Since 2021, spending has risen 29.1% (about 6.6% a year), while prices rose about 18.7%, a real rise of about 8.8%.
Where does this data come from?
From U.S. Bureau of Labor Statistics, Consumer Expenditures—2025 (news release USDL-26-1619, 29 October 2026), tables 1 to 3; U.S. Bureau of Labor Statistics, Consumer expenditures in 2024 (BLS Report 1119, August 2026), tables 1 and 2, covering 2021–2025. Averages for all consumer units (households) of the BLS Consumer Expenditure Survey. Because of the 2025 lapse in federal appropriations, the Census Bureau could not collect the survey in October and November 2025; BLS adjusted the survey weights to account for the missing months. BLS did not find the 2024 to 2025 change statistically significant, so treat it with caution.
How this page was made
Generated by Advanton from U.S. Bureau of Labor Statistics, Consumer Expenditures—2025 (2021–2025), data updated 10 November 2026: chart, ranks, comparisons and text are computed from the published figures; no figures are changed. Our methodology.
Data
| Year | Average spending per household ($ a year) |
|---|---|
| 2021 | $1,226 |
| 2022 | $1,335 |
| 2023 | $1,535 |
| 2024 | $1,569 |
| 2025 | $1,583 |
Source and notes
Source: U.S. Bureau of Labor Statistics, Consumer Expenditures—2025 (news release USDL-26-1619, 29 October 2026), tables 1 to 3; U.S. Bureau of Labor Statistics, Consumer expenditures in 2024 (BLS Report 1119, August 2026), tables 1 and 2. Period: 2021–2025. Coverage: United States.
Averages for all consumer units (households) of the BLS Consumer Expenditure Survey. Because of the 2025 lapse in federal appropriations, the Census Bureau could not collect the survey in October and November 2025; BLS adjusted the survey weights to account for the missing months. BLS did not find the 2024 to 2025 change statistically significant, so treat it with caution.
Cite this statistic
Formats, embedding and reuse: how to cite Advanton.
Please also credit the original source: U.S. Bureau of Labor Statistics, Consumer Expenditures—2025 (news release USDL-26-1619, 29 October 2026), tables 1 to 3; U.S. Bureau of Labor Statistics, Consumer expenditures in 2024 (BLS Report 1119, August 2026), tables 1 and 2.Related statistics
- Where US household money goes: spending by category, 2025
- US household spending and income by income level, 2025
- Average annual spending of US households, 2021–2025
- US household spending on food away from home (restaurants and takeout), 2021–2025
- US household housing spending by type, 2025
Need more detail? Build a free India market report for any business and state.
Last reviewed November 9, 2026. Startup costs are estimates; check local prices, licensing and tax rules before you commit money.