• Skip to primary navigation
  • Skip to main content
  • Skip to footer
advanton usa logo

Advanton

  • Data
    • Ask and find
      • Find answersCommon questions answered with official data
      • Ask AdvantonAsk a question in plain words
      • All statistics8,700+ statistics, searchable
      • Your state or countryHow any place ranks on every measure
      • Compare 217 countriesWorld data explorer
    • Topics
      • India consumer spending
      • India GST by state
      • India population
      • US consumer spending
      • US markets and e-commerce
      • World economy
    • Industries
      • Industry statisticsKey figures for 12 industries
      • US industry dataProfiles of US industries
      • Market size estimates200 business types in India
      • Indian small businesses
      • India’s factories
      • US industries and jobs
    • Stories and methods
      • Data storiesSurprising findings, checked against sources
      • Charts
      • MethodologyHow every figure is made
      • How to citeCredit and link the source
  • Market Research
    • Market report builderA market overview for any business and state
    • Test your business ideaCheck an idea against real data
    • Advanton ReportsOriginal research on consumers and small businesses
    • How to calculate market sizeTAM, SAM and SOM with worked examples
    • Market research for small businessA step-by-step guide
    • Free market data: IndiaOfficial Indian sources and how to use them
    • Free market data: USUS government data for market research
    • All market research guides
  • Start & Grow
    • Start a business
      • How to start a business, A to Z
      • Business ideas
      • Choosing a business structure
      • Get an EIN
      • SBA loans
      • Small business grants
      • Business banking
      • Franchises
      • Guides for Indian businesses
    • Grow your business
      • Hiring your first employee
      • Taxes and bookkeeping
      • Keeping customers
      • Financing growth
      • Using AI
      • Services owners use
    • Free tools
      • Start tools
      • Launch tools
      • Market tools
      • Grow tools
      • All free tools
    • Contractors
      • Contractor website builderWebsites for 8 trades, 5 designs each
      • Websites by trade
      • Yard signs and door hangersYard signs and door hangers with a QR code
      • Marketing for contractors
      • Angi vs Thumbtack
  • Directory
    • Browse US businessesFind local small businesses
    • Browse Indian businesses
    • List a US businessA free listing in the directory
    • List an Indian businessA free listing in the directory
    • US local deals
    • India local deals
    • Business owner login
  • Who it’s for
    • SEO agencies and consultantsCite, embed and download data for clients
    • Founders and startupsValidate an idea and size the market
    • Loan applicationsMarket data lenders trust
    • Students and researchersSourced data you can cite
    • JournalistsQuotable findings and how to credit them
  • Get Online
    • Launch your business onlineDomain, website and hosting, step by step
    • Free website builderA free website in about 10 minutes
    • Contractor website builderWebsites for 8 trades, 5 designs each
    • Local SEO CheckSee what to fix to rank in local search
    • Domains & hosting
  • Or browse Find answers: common questions answered with official data.

  • My account
Home » US Home Sales and Mortgage Payments, October 2026: Sales, Prices and Monthly Costs

US Home Sales and Mortgage Payments, October 2026: Sales, Prices and Monthly Costs

November 16, 2026

Key figures

  • Existing-home sales: 3.75 million a year (seasonally adjusted annual rate) in October 2026, down 8.8% from a year earlier and the lowest since August 2010 (NAR).
  • Median existing-home price: $416,700, up just 0.4% in a year.
  • 30-year mortgage rate: 7.11% (12 November 2026), against 6.24% a year earlier (Freddie Mac).
  • On a median-priced home with 20% down, the monthly payment is $2,243, about $193 more than at last year’s rate: $2,316 a year.

US home sales have slowed to their lowest level in 16 years. In October 2026, existing homes sold at an annual rate of 3.75 million, according to the National Association of Realtors (NAR), as the 30-year mortgage rate rose to 7.11% from 6.24% a year earlier while prices barely moved.

Data: NAR existing-home sales for October 2026 (released 12 November 2026); Freddie Mac Primary Mortgage Market Survey (12 November 2026); monthly payments calculated by Advanton. Updated monthly.

The market in October 2026

Table of Contents

  • The market in October 2026
  • Monthly payment at different rates
  • Monthly mortgage payment on a median-priced US home
  • Cite this chart
  • Embed this chart
  • What the rate rise costs a buyer
  • Understanding the numbers
    • "3.75 million a year" explained
    • Median price, not average
    • Months of supply
    • First-time buyers are being squeezed out
  • Why rates matter more than prices right now
    • With a smaller down payment
  • What this means
  • Frequently asked questions
  • About the data
  • Use this chart
Measure October 2025 September 2026 October 2026
Sales (annual rate) about 4.11 million* 3.75 million
Median price $414,900 $416,700
First-time buyers’ share of sales 32% 31% 29%
Months of supply 4.4 4.7 5.1
Homes for sale 1.59 million
30-year fixed mortgage rate 6.24% (Nov 2025) 7.11% (12 Nov 2026)
15-year fixed mortgage rate 5.49% (Nov 2025) 6.45%

Implied by NAR’s 8.8% year-on-year fall.

Fewer first-time buyers, more homes waiting longer for buyers (5.1 months of supply, up from 4.4), and almost no price growth: a market where rates, not prices, are doing the work.

Monthly payment at different rates

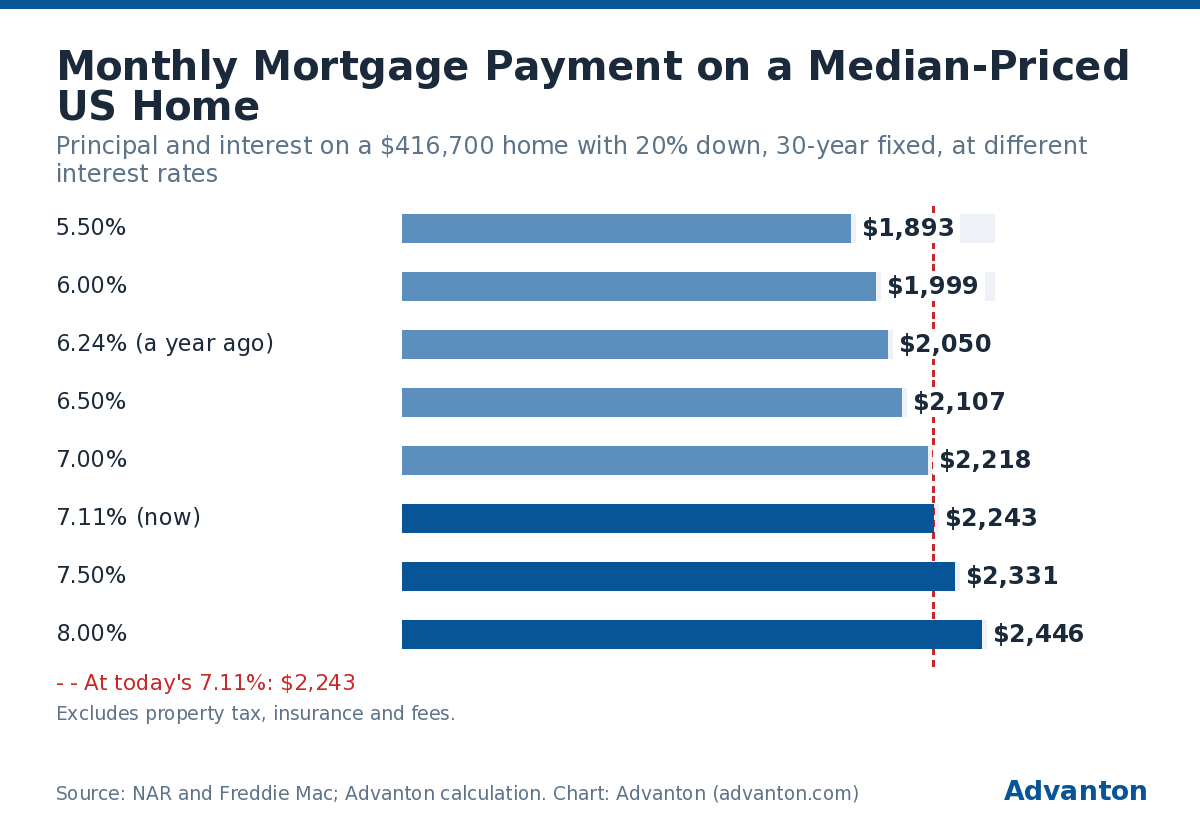
Monthly mortgage payment on a median-priced US home

Principal and interest on a $416,700 home with 20% down, 30-year fixed, at different interest rates
ImageData (CSV)
5.50%$1,893
6.00%$1,999
6.24% (a year ago)$2,050
6.50%$2,107
7.00%$2,218
7.11% (now)$2,243
7.50%$2,331
8.00%$2,446

At today's 7.11%: $2,243

Excludes property tax, insurance and fees.

Source: Advanton calculation: 30-year fixed loan on the US median existing-home price of $416,700 (NAR, October 2026) with 20% down; rates from Freddie Mac PMMS (12 November 2026: 7.11%; a year earlier: 6.24%). Chart by Advanton. More data and charts.

Cite this chart

Pick a style, then copy. Please link to the chart page so readers can see the full data.

Embed this chart

Free to use on your website or blog. Paste the code where you want the chart. Please keep the credit line.

"Auto height" sizes the chart to fit. Some website builders remove scripts; use "Without script" there.

Preview
Mortgage rate Monthly payment, 20% down Monthly payment, 10% down
5.50% $1,893 $2,129
6.00% $1,999 $2,248
6.24% (a year ago) $2,050 $2,307
6.50% $2,107 $2,370
7.00% $2,218 $2,495
7.11% (now) $2,243 $2,523
7.50% $2,331 $2,622
8.00% $2,446 $2,752

Principal and interest only, 30-year fixed loan on a $416,700 home (loan of $333,360 with 20% down, $375,030 with 10% down). Property taxes, insurance, mortgage insurance and fees are extra.

What the rate rise costs a buyer

At today’s 7.11% instead of last year’s 6.24%, a buyer of a median-priced home with 20% down pays:

  • $193 more a month ($2,243 vs $2,050);
  • about $2,300 more a year;
  • about $69,000 more over 30 years, if the loan runs its full term without refinancing.

Understanding the numbers

"3.75 million a year" explained

NAR reports sales as a seasonally adjusted annual rate: the number of homes that would sell in a year if every month were like October, after allowing for normal seasonal patterns. It counts sales of existing homes (houses, townhouses, condos and co-ops), not newly built ones.

Median price, not average

Half of the homes sold for more than $416,700 and half for less. The median moves with the mix of homes sold, not only with prices, so a 0.4% change is best read as "prices broadly flat".

Months of supply

At the current pace of sales, the 1.59 million homes for sale would take 5.1 months to sell, up from 4.4 a year earlier. More months of supply means more choice for buyers and less pressure on prices; around six months is often described as a balanced market.

First-time buyers are being squeezed out

First-time buyers made up 29% of sales in October, down from 32% a year earlier. They usually have the smallest down payments and no home equity to bring, so higher monthly payments hit them hardest.

Why rates matter more than prices right now

Prices barely moved in a year (+0.4%), but the 30-year mortgage rate rose from 6.24% to 7.11%. On a median-priced home with 20% down, that adds $193 a month. A 4% rise in the price at last year’s rate would have added only about $82. The rate change has the same effect on the payment as a price rise of roughly 9%. For most buyers, the monthly payment, not the price tag, decides what they can afford.

A rule of thumb from the table: on this loan, every quarter-point (0.25%) on the rate adds roughly $55 a month to the payment.

With a smaller down payment

With 10% down, the loan is larger ($375,030), the payment at 7.11% is $2,523, and most lenders also require private mortgage insurance until the loan falls to 80% of the home’s value, so the real monthly cost is higher still.

What this means

  • Buyers: compare offers on the annual percentage rate (APR) and points, not just the rate. Even a small rate difference is worth thousands over the loan.
  • Sellers: with 5.1 months of supply, homes take longer to sell; pricing correctly from the start matters more.
  • Businesses tied to housing (movers, remodellers, furniture, mortgage brokers, inspectors): fewer sales mean fewer moves and fewer jobs; see our guides for home services and small business finance.

Frequently asked questions

How many homes sold in the US in October 2026?
Existing-home sales ran at a seasonally adjusted annual rate of 3.75 million, down 5.5% from September and 8.8% from a year earlier, NAR reported on 12 November 2026.

What is the median home price in the US?
$416,700 for existing homes in October 2026, up 0.4% from $414,900 a year earlier.

What is the current 30-year mortgage rate?
7.11% on average in Freddie Mac’s survey for the week of 12 November 2026, against 6.24% a year earlier.

How much is the monthly payment on a median-priced home?
About $2,243 in principal and interest with 20% down at 7.11%, before taxes and insurance; $2,523 with 10% down.

About the data

  • Sales and prices: National Association of Realtors, existing-home sales, October 2026 (12 November 2026). Sales are seasonally adjusted annual rates; the median price is not seasonally adjusted.
  • Mortgage rates: Freddie Mac Primary Mortgage Market Survey, weekly average for 12 November 2026, and the same week a year earlier.
  • Payments: standard 30-year fixed amortisation formula, calculated by Advanton.

Use this chart

Cite or embed the payment chart free with the buttons above it. Please keep the credit link.

Last reviewed November 17, 2026. Startup costs are estimates; check local prices, licensing and tax rules before you commit money.

Advanton presents official data as easy-to-read charts and figures. The figures on this page come from the sources named with each statistic and chart, and those sources may revise them. This page is general information, not financial or investment advice. See our disclaimer.

Keep reading

  • Minimum Wage by State, 2026 and 2027: Current Rates and January 2027 Increases
  • Holiday Price Changes, 2026: Food, Gifts and Travel Compared With a Year Ago
  • Hours of Work Needed to Pay Rent, by State, 2026
  • LLC Filing Fees by State, 2026: Cost to Form and Yearly Fees in All 50 States

Share this guide

Filed Under: Data Stories Tagged With: home prices, housing, mortgage rates, United States

Local SEO Check Free: scan your website and see what to fix to rank in local search →

Data

  • Statistics
  • Data and charts
  • Find answers
  • Your state or country
  • Industry statistics
  • Data stories
  • Compare 217 countries
  • Methodology

Start and grow

  • Start a business, A to Z
  • Business ideas
  • LLC by state
  • Industry data
  • USPS for small business
  • Grow your business
  • Google Business Profile guide
  • Online marketing guide

Free tools

  • Website builder
  • Local SEO Check
  • Business Planner
  • Quotes and invoices
  • Rewards program
  • Brand & Print Studio
  • All free tools

Get online

  • Launch your business online
  • Domains and hosting
  • Verify your new domain
  • Upload your website
  • Set up business email
  • For contractors

Advanton

  • About
  • How it works
  • Contact
  • Business directory
  • Add your business
  • Privacy policy
  • Terms of use
  • Disclaimer

Advanton Free market data, guides and tools for small businesses in the US, India and worldwide.

Advanton earns money when you buy a domain or hosting through our store. It helps keep our guides and tools free.

Footer

About ADVANTON

Free guides and tools that help small businesses start, launch online, find customers and grow.

Copyright © 2026 — ADVANTON • All rights reserved. • Privacy Policy

Expand · Multiply · Grow

Your next customer is already here.

Thousands of business owners use Advanton every month. Put your products and services in front of them.

Feature it in a Display Popup or a Sponsored Post

Get discovered